Canonical correlation analysis (CCA) explores relationships between two sets of variables by maximizing their correlations, while noncanonical methods focus on alternative association structures or constraints beyond maximum correlation. CCA is widely used in multivariate statistics to identify linear combinations with the strongest associations, contrasting with noncanonical approaches that may emphasize interpretability or specific research questions. Discover more about how these techniques differ and their applications in complex data analysis.
Main Difference
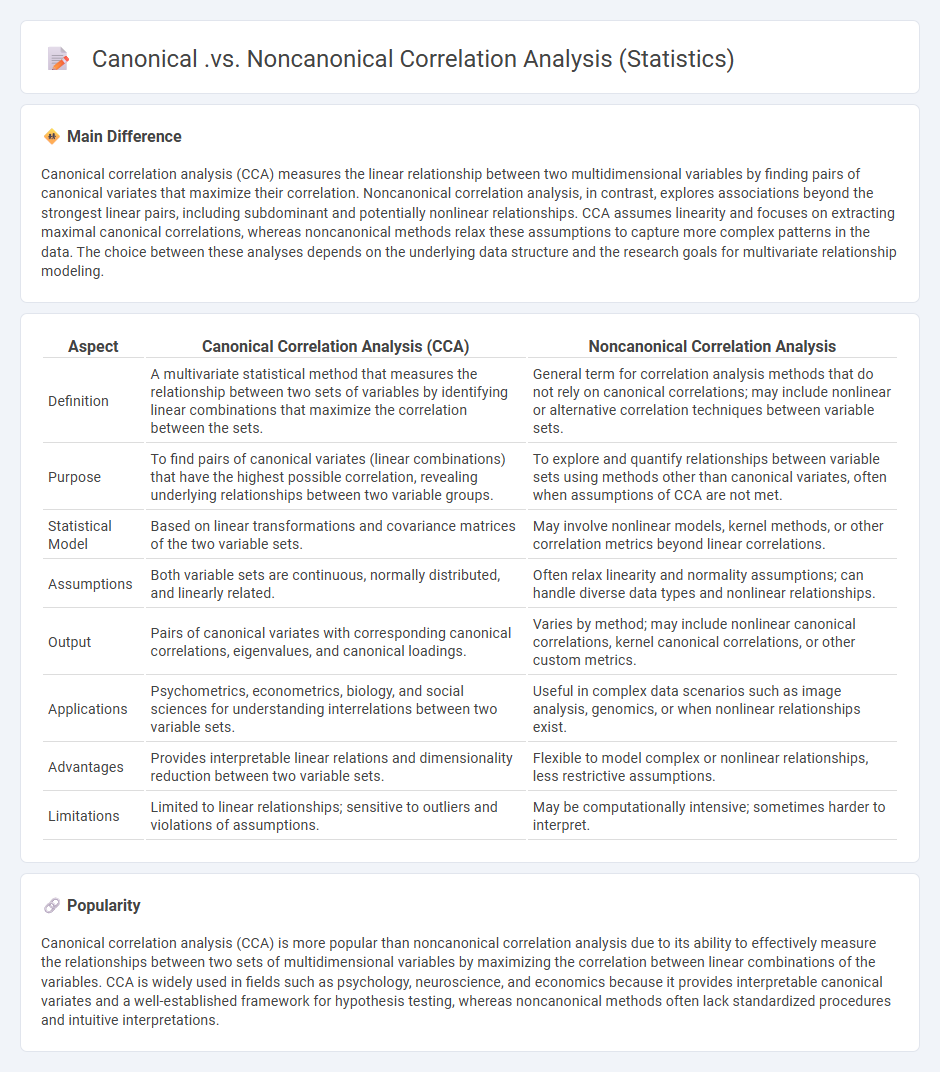
Canonical correlation analysis (CCA) measures the linear relationship between two multidimensional variables by finding pairs of canonical variates that maximize their correlation. Noncanonical correlation analysis, in contrast, explores associations beyond the strongest linear pairs, including subdominant and potentially nonlinear relationships. CCA assumes linearity and focuses on extracting maximal canonical correlations, whereas noncanonical methods relax these assumptions to capture more complex patterns in the data. The choice between these analyses depends on the underlying data structure and the research goals for multivariate relationship modeling.
Connection
Canonical correlation analysis (CCA) explores relationships between two sets of variables by identifying linear combinations that maximize their correlation, while noncanonical correlation analysis extends this framework to settings involving more than two variable sets or nonlinear relationships. Both methods assess multivariate correlations but differ in scope and complexity: CCA targets paired variable sets with linear assumptions; noncanonical approaches accommodate multiple datasets or nonlinear associations. These techniques are connected through their goal of uncovering underlying correlated structures in multivariate statistical analysis.
Comparison Table
| Aspect | Canonical Correlation Analysis (CCA) | Noncanonical Correlation Analysis |
|---|---|---|
| Definition | A multivariate statistical method that measures the relationship between two sets of variables by identifying linear combinations that maximize the correlation between the sets. | General term for correlation analysis methods that do not rely on canonical correlations; may include nonlinear or alternative correlation techniques between variable sets. |
| Purpose | To find pairs of canonical variates (linear combinations) that have the highest possible correlation, revealing underlying relationships between two variable groups. | To explore and quantify relationships between variable sets using methods other than canonical variates, often when assumptions of CCA are not met. |
| Statistical Model | Based on linear transformations and covariance matrices of the two variable sets. | May involve nonlinear models, kernel methods, or other correlation metrics beyond linear correlations. |
| Assumptions | Both variable sets are continuous, normally distributed, and linearly related. | Often relax linearity and normality assumptions; can handle diverse data types and nonlinear relationships. |
| Output | Pairs of canonical variates with corresponding canonical correlations, eigenvalues, and canonical loadings. | Varies by method; may include nonlinear canonical correlations, kernel canonical correlations, or other custom metrics. |
| Applications | Psychometrics, econometrics, biology, and social sciences for understanding interrelations between two variable sets. | Useful in complex data scenarios such as image analysis, genomics, or when nonlinear relationships exist. |
| Advantages | Provides interpretable linear relations and dimensionality reduction between two variable sets. | Flexible to model complex or nonlinear relationships, less restrictive assumptions. |
| Limitations | Limited to linear relationships; sensitive to outliers and violations of assumptions. | May be computationally intensive; sometimes harder to interpret. |
Linear Relationship
A linear relationship describes a direct proportionality between two variables, where the change in one variable results in a consistent change in the other. Represented by the equation y = mx + b, it features a constant slope (m) and y-intercept (b), forming a straight line on a Cartesian plane. This type of relationship is fundamental in statistics, physics, and economics for modeling correlations and predicting outcomes. Linear relationships simplify complex data patterns, making them easier to analyze and interpret.
Multivariate Data
Multivariate data involves observations with multiple variables recorded for each subject or entity, enabling complex analysis of relationships and patterns. Common techniques used to analyze multivariate data include principal component analysis (PCA), cluster analysis, and multiple regression. Fields such as finance, healthcare, and social sciences rely heavily on multivariate data to uncover insights from large datasets with numerous correlated variables. Proper handling of multivariate data improves predictive accuracy and aids in informed decision-making across various industries.
Assumptions (Normality, Linearity)
Assumptions of normality and linearity are fundamental for many statistical analyses, including regression and ANOVA. Normality assumes that the residuals or errors in the data are normally distributed, ensuring valid hypothesis testing and confidence intervals. Linearity assumes a straight-line relationship between independent and dependent variables, which is essential for accurate model predictions. Violations of these assumptions can lead to biased estimates, reduced statistical power, and incorrect conclusions.
Kernel Methods
Kernel methods leverage positive definite kernel functions to implicitly map data into high-dimensional feature spaces, enabling linear algorithms to perform nonlinear classification and regression tasks. Popular kernels such as the Gaussian Radial Basis Function (RBF), polynomial, and sigmoid kernels are widely used in support vector machines (SVMs) to achieve superior generalization on complex datasets. These methods efficiently compute inner products in transformed spaces without explicit feature construction, known as the "kernel trick," which reduces computational complexity. Applications span bioinformatics, image recognition, and natural language processing, demonstrating robustness in handling structured and high-dimensional data.
Feature Extraction
Feature extraction involves transforming raw data into a set of measurable features essential for machine learning models and data analysis. Techniques such as Principal Component Analysis (PCA), Linear Discriminant Analysis (LDA), and wavelet transforms are widely used for dimensionality reduction and noise minimization. In image processing, algorithms like Scale-Invariant Feature Transform (SIFT) and Histogram of Oriented Gradients (HOG) are critical for identifying edges, textures, and shapes. Effective feature extraction enhances model accuracy by improving data representation and reducing computational complexity.
Source and External Links
Conduct and Interpret a Canonical Correlation - Canonical correlation analysis (CCA) is a multivariate method analyzing the correlation between two sets of variables via canonical variates, contrasting with noncanonical methods that do not form paired variates maximizing correlations.
What is Canonical Correlation Analysis? - Canonical correlation finds linear combinations of two variable groups that maximize correlation, differing from noncanonical approaches which typically analyze relationships without forming such canonical variates or maximizing correlation between sets.
Canonical Correlation Analysis in SPSS - CCA specifically creates pairs of canonical variates from two variable sets to explore their maximal associations, whereas noncanonical correlation analysis might involve simpler correlation or regression methods without this paired variate structure.
FAQs
What is canonical correlation analysis?
Canonical correlation analysis is a statistical method that measures the relationships between two sets of multidimensional variables by identifying linear combinations that maximize their correlation.
What is noncanonical correlation analysis?
Noncanonical correlation analysis is a statistical technique that identifies complex, nonlinear relationships between two multivariate datasets beyond traditional linear canonical correlations.
How do canonical and noncanonical correlation analysis differ?
Canonical correlation analysis measures linear relationships between two sets of variables by finding maximally correlated linear combinations, while noncanonical correlation analysis explores nonlinear or alternative dependency structures beyond linear correlations.
When should canonical correlation analysis be used?
Canonical correlation analysis should be used when exploring the relationships between two sets of multivariate variables to identify and measure the associations between their linear combinations.
What are the assumptions of canonical correlation analysis?
Canonical correlation analysis assumes linear relationships between variable sets, multivariate normality, homoscedasticity, absence of multicollinearity within variable sets, and that variables are measured without error.
What are the limitations of noncanonical correlation analysis?
Noncanonical correlation analysis is limited by its inability to identify unique pairs of canonical variates, lower interpretability compared to canonical analysis, sensitivity to multicollinearity, and challenges in handling nonlinear relationships and high-dimensional data.
How are results interpreted in canonical versus noncanonical analysis?
Results in canonical analysis are interpreted by examining the canonical correlations, canonical variates, and their associated loadings to understand the relationships between two sets of variables, while in noncanonical analysis, interpretations focus on individual variable relationships or nonlinear associations without the constraints of maximizing correlations between variable sets.