The Balanced Scorecard offers a comprehensive strategic management framework that links performance metrics with long-term organizational goals across financial, customer, internal process, and learning perspectives. In contrast, a KPI Dashboard provides real-time visualization of key performance indicators, enabling quick monitoring and decision-making focused on specific operational metrics. Explore the differences and applications of Balanced Scorecards and KPI Dashboards to optimize your performance management strategy.
Main Difference
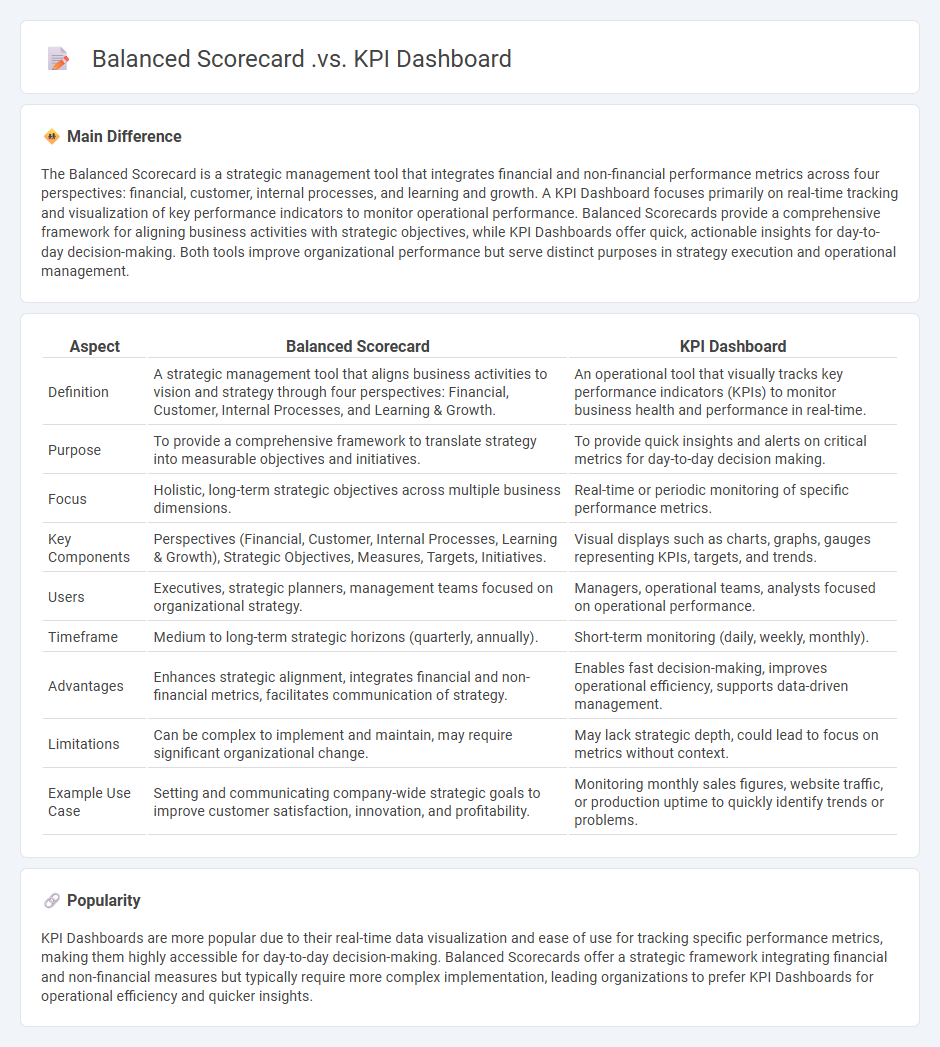
The Balanced Scorecard is a strategic management tool that integrates financial and non-financial performance metrics across four perspectives: financial, customer, internal processes, and learning and growth. A KPI Dashboard focuses primarily on real-time tracking and visualization of key performance indicators to monitor operational performance. Balanced Scorecards provide a comprehensive framework for aligning business activities with strategic objectives, while KPI Dashboards offer quick, actionable insights for day-to-day decision-making. Both tools improve organizational performance but serve distinct purposes in strategy execution and operational management.
Connection
The Balanced Scorecard translates an organization's vision and strategy into a coherent set of performance measures across financial, customer, internal processes, and learning perspectives. KPI Dashboards visually display these key performance indicators in real-time, enabling managers to monitor progress against strategic goals effectively. Together, they integrate strategic planning with operational execution by linking high-level objectives with actionable metrics and performance tracking.
Comparison Table
| Aspect | Balanced Scorecard | KPI Dashboard |
|---|---|---|
| Definition | A strategic management tool that aligns business activities to vision and strategy through four perspectives: Financial, Customer, Internal Processes, and Learning & Growth. | An operational tool that visually tracks key performance indicators (KPIs) to monitor business health and performance in real-time. |
| Purpose | To provide a comprehensive framework to translate strategy into measurable objectives and initiatives. | To provide quick insights and alerts on critical metrics for day-to-day decision making. |
| Focus | Holistic, long-term strategic objectives across multiple business dimensions. | Real-time or periodic monitoring of specific performance metrics. |
| Key Components | Perspectives (Financial, Customer, Internal Processes, Learning & Growth), Strategic Objectives, Measures, Targets, Initiatives. | Visual displays such as charts, graphs, gauges representing KPIs, targets, and trends. |
| Users | Executives, strategic planners, management teams focused on organizational strategy. | Managers, operational teams, analysts focused on operational performance. |
| Timeframe | Medium to long-term strategic horizons (quarterly, annually). | Short-term monitoring (daily, weekly, monthly). |
| Advantages | Enhances strategic alignment, integrates financial and non-financial metrics, facilitates communication of strategy. | Enables fast decision-making, improves operational efficiency, supports data-driven management. |
| Limitations | Can be complex to implement and maintain, may require significant organizational change. | May lack strategic depth, could lead to focus on metrics without context. |
| Example Use Case | Setting and communicating company-wide strategic goals to improve customer satisfaction, innovation, and profitability. | Monitoring monthly sales figures, website traffic, or production uptime to quickly identify trends or problems. |
Strategic Alignment
Strategic alignment in business ensures that organizational goals, resources, and activities are consistently directed toward a common vision, enhancing overall performance and competitive advantage. It involves synchronizing corporate strategy with operational processes, technology, and employee objectives to maximize efficiency and innovation. Companies like IBM and Google exemplify strategic alignment by integrating business objectives with IT infrastructure and talent management. Effective strategic alignment leads to improved decision-making, resource allocation, and the ability to respond swiftly to market changes.
Performance Measurement
Performance measurement in business involves systematically tracking key performance indicators (KPIs) such as revenue growth, profit margins, and customer satisfaction scores to evaluate organizational success. Techniques like balanced scorecards and benchmarking enable companies to align operational activities with strategic goals. Effective performance measurement drives data-informed decision-making, enhances productivity, and supports continuous improvement initiatives. Leading businesses invest in real-time analytics platforms to gain actionable insights and maintain competitive advantage.
Real-Time Monitoring
Real-time monitoring in business enables continuous tracking of key performance indicators (KPIs) such as sales, customer engagement, and inventory levels through advanced analytics platforms like Tableau and Power BI. Enterprises leverage Internet of Things (IoT) devices and cloud computing to capture and analyze data instantaneously, facilitating rapid decision-making and operational efficiency. Companies in industries such as retail, manufacturing, and finance use real-time dashboards to detect anomalies, forecast demand, and optimize supply chains. This approach minimizes downtime, reduces costs, and enhances customer satisfaction by providing actionable insights in real time.
Long-Term Objectives
Long-term objectives in business focus on sustained growth, market expansion, and innovation leadership over a multi-year horizon, typically spanning five to ten years. These goals emphasize increasing market share, enhancing brand equity, and improving operational efficiency through strategic investments in technology and human capital. Companies like Apple Inc. set long-term objectives to pioneer new product categories and achieve carbon neutrality by 2030, illustrating the integration of sustainability with business growth. Establishing clear, measurable long-term objectives guides resource allocation and aligns organizational efforts toward enduring competitive advantage.
Decision-Making Insights
Effective decision-making in business relies on data-driven insights that prioritize financial metrics, customer behavior analytics, and market trends. Leveraging advanced tools like predictive analytics and artificial intelligence enhances accuracy and reduces risks associated with strategic choices. Companies that integrate real-time data visualization platforms experience improved agility, allowing them to adapt swiftly to changing competitive landscapes. Emphasizing cognitive biases awareness during the decision process further optimizes outcomes and drives sustainable growth.
Source and External Links
Balanced scorecards, strategy maps, & dashboards - Balanced Scorecards monitor strategic progress with targeted KPIs linked to goals and predefined targets, while Dashboards are operational tools providing real-time or frequent updates on process metrics without necessarily linking them to strategic objectives.
Comparing the Balanced Scorecard and Key Performance Indicators - The Balanced Scorecard is a broad strategic framework integrating multiple perspectives (financial, customer, internal process, learning and growth), whereas KPIs are specific, measurable metrics focused on detailed performance areas, often more operational or departmental.
Balanced Scorecard and Dashboard - Balanced Scorecards use KPIs and KPOVs to track strategic goals over time with periodic updates, while Dashboards provide continuous, at-a-glance monitoring of key metrics to highlight operational performance and trends.
FAQs
What is a Balanced Scorecard?
A Balanced Scorecard is a strategic management tool that measures organizational performance across four perspectives: Financial, Customer, Internal Processes, and Learning & Growth, aligning business activities with vision and strategy.
What is a KPI Dashboard?
A KPI Dashboard is a visual interface that displays key performance indicators (KPIs) to monitor and analyze business metrics in real-time for informed decision-making.
How does a Balanced Scorecard differ from a KPI Dashboard?
A Balanced Scorecard integrates financial and non-financial strategic objectives across multiple perspectives (financial, customer, internal processes, learning and growth), while a KPI Dashboard focuses primarily on real-time tracking and visualization of specific key performance indicators.
What are the main components of a Balanced Scorecard?
The main components of a Balanced Scorecard are Financial, Customer, Internal Business Processes, and Learning & Growth perspectives.
What are the key features of a KPI Dashboard?
Key features of a KPI dashboard include real-time data visualization, customizable metrics, interactivity, trend analysis, goal tracking, automated data updates, and user-friendly interface.
When should you use a Balanced Scorecard instead of a KPI Dashboard?
Use a Balanced Scorecard when you need a strategic management tool to align business activities with vision and strategy across multiple perspectives--financial, customer, internal processes, and learning and growth--whereas a KPI Dashboard is ideal for real-time monitoring and tracking of specific performance metrics.
How do Balanced Scorecards and KPI Dashboards support decision-making?
Balanced Scorecards align strategic objectives with performance metrics to provide a comprehensive view of organizational goals, while KPI Dashboards offer real-time data visualization of key performance indicators, enabling quicker and more informed decision-making.