Statistical discrimination occurs when decisions are made based on group averages or stereotypes rather than individual characteristics, affecting hiring, lending, and law enforcement outcomes. Taste-based discrimination arises from personal prejudices or preferences that lead to unequal treatment of individuals regardless of their qualifications or behavior. Explore more to understand how these types of discrimination impact policies and social equity.
Main Difference
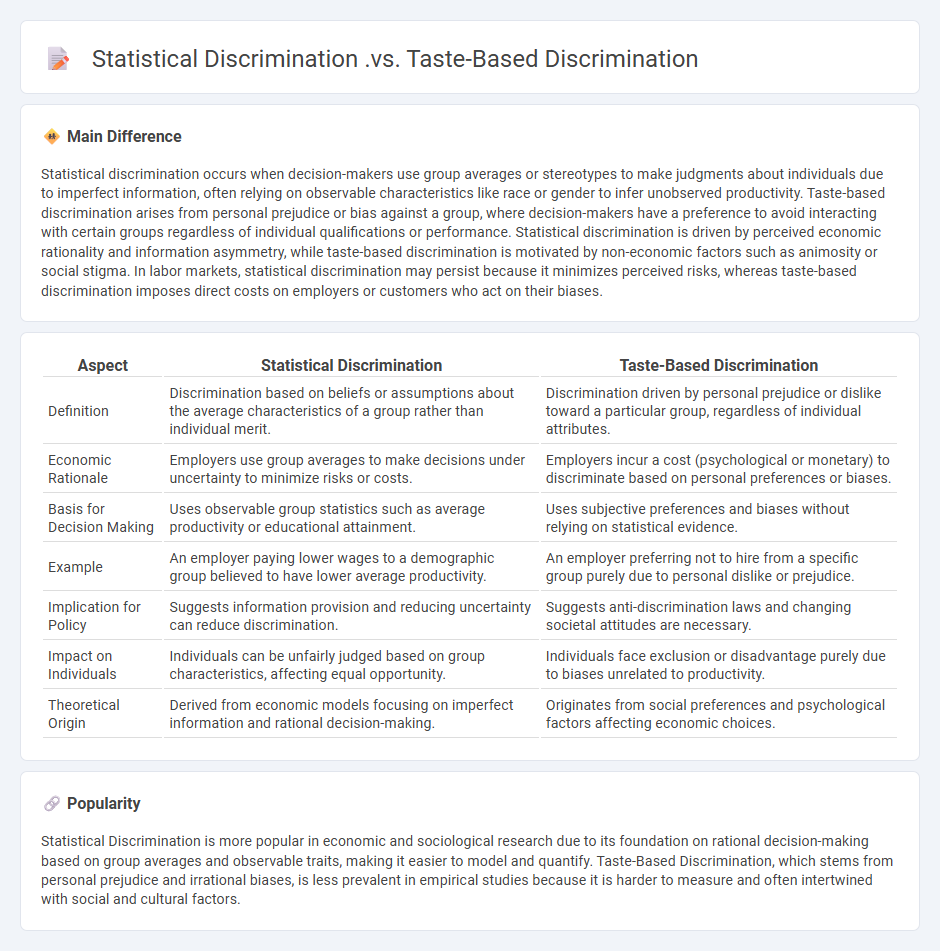
Statistical discrimination occurs when decision-makers use group averages or stereotypes to make judgments about individuals due to imperfect information, often relying on observable characteristics like race or gender to infer unobserved productivity. Taste-based discrimination arises from personal prejudice or bias against a group, where decision-makers have a preference to avoid interacting with certain groups regardless of individual qualifications or performance. Statistical discrimination is driven by perceived economic rationality and information asymmetry, while taste-based discrimination is motivated by non-economic factors such as animosity or social stigma. In labor markets, statistical discrimination may persist because it minimizes perceived risks, whereas taste-based discrimination imposes direct costs on employers or customers who act on their biases.
Connection
Statistical discrimination and taste-based discrimination are connected through their impact on decision-making processes, where statistical discrimination relies on group averages and perceived probabilities, while taste-based discrimination stems from personal prejudices or biases against certain groups. Both forms of discrimination lead to unequal treatment in labor markets, education, and social interactions, reinforcing systemic inequalities. Understanding their interplay helps in designing policies aimed at reducing bias and promoting fairness in economic and social systems.
Comparison Table
| Aspect | Statistical Discrimination | Taste-Based Discrimination |
|---|---|---|
| Definition | Discrimination based on beliefs or assumptions about the average characteristics of a group rather than individual merit. | Discrimination driven by personal prejudice or dislike toward a particular group, regardless of individual attributes. |
| Economic Rationale | Employers use group averages to make decisions under uncertainty to minimize risks or costs. | Employers incur a cost (psychological or monetary) to discriminate based on personal preferences or biases. |
| Basis for Decision Making | Uses observable group statistics such as average productivity or educational attainment. | Uses subjective preferences and biases without relying on statistical evidence. |
| Example | An employer paying lower wages to a demographic group believed to have lower average productivity. | An employer preferring not to hire from a specific group purely due to personal dislike or prejudice. |
| Implication for Policy | Suggests information provision and reducing uncertainty can reduce discrimination. | Suggests anti-discrimination laws and changing societal attitudes are necessary. |
| Impact on Individuals | Individuals can be unfairly judged based on group characteristics, affecting equal opportunity. | Individuals face exclusion or disadvantage purely due to biases unrelated to productivity. |
| Theoretical Origin | Derived from economic models focusing on imperfect information and rational decision-making. | Originates from social preferences and psychological factors affecting economic choices. |
Stereotypes
Economic stereotypes often influence perceptions about income levels, work ethic, and spending habits across different social groups. Research shows that stereotypes can affect hiring decisions, wage disparities, and access to financial services, contributing to persistent economic inequalities. Behavioral economics studies demonstrate that these biases impact consumer behavior, investment choices, and market outcomes. Addressing economic stereotypes requires targeted policies promoting diversity, equity, and inclusion within labor markets and financial systems.
Preference bias
Preference bias occurs when consumer choices are systematically influenced by irrational factors, leading to deviations from traditional utility maximization models. This bias affects demand estimation, causing over- or underestimation of consumer valuation for goods and services. Behavioral economics integrates preference bias to explain anomalies in market behavior, such as the endowment effect and loss aversion. Empirical studies show that ignoring preference bias can distort pricing strategies and impact welfare analysis.
Group averages
Group averages in economics refer to the mean values calculated from data sets representing different economic agents, such as households, firms, or countries. These averages help analyze income distribution, consumption patterns, productivity levels, and economic growth rates. Prominent examples include calculating the average GDP per capita to compare living standards or the average inflation rate to assess price stability across regions. Economists use group averages to identify trends, disparities, and inform policy decisions targeting specific segments of the economy.
Rational expectations
Rational expectations theory asserts that individuals and firms make forecasts about future economic variables by efficiently using all available information, including government policies and market trends. This concept assumes that economic agents' predictions are unbiased and statistically optimal, minimizing systematic errors over time. Developed in the 1960s by economist John F. Muth and later popularized by Robert Lucas, the theory challenges traditional adaptive expectations models by integrating forward-looking behavior. Rational expectations form a foundational pillar in modern macroeconomic models such as the New Classical and Real Business Cycle frameworks.
Social welfare impact
Social welfare impact in economics measures the effect of policies, market changes, or economic activities on the overall well-being and economic efficiency of individuals and society. It considers both consumer surplus and producer surplus to evaluate gains or losses in welfare. Key tools for assessment include cost-benefit analysis and welfare economics frameworks established by economists like Arthur Pigou and Vilfredo Pareto. Empirical studies often focus on income redistribution, public goods provision, and externalities to quantify social welfare changes.
Source and External Links
Determining the Extent of Taste-Based and Statistical Discrimination - Taste-based discrimination arises from dislike of certain groups, while statistical discrimination occurs when decisions are based on beliefs about group characteristics due to imperfect information, with evidence suggesting many discriminators act mostly on statistical grounds rather than personal bias.
Statistical and Taste-Based Discrimination in Labor Market - EPC 2024 - Statistical discrimination relies on stereotypes to predict productivity under imperfect information, whereas taste-based discrimination stems from personal bias, requiring different policy responses such as legal regulation and diversity training for taste-based, and efforts addressing perceived productivity gaps for statistical discrimination.
Taste-based discrimination - Wikipedia - Taste-based discrimination refers to employer, customer, or coworker prejudice leading to hiring decisions based on dislike for certain groups regardless of productivity, often involving a willingness to incur financial costs to avoid interaction with those groups, contrasting with statistical discrimination which is based on beliefs about average group characteristics.
FAQs
What is discrimination in economics?
Discrimination in economics refers to the unequal treatment of individuals or groups based on characteristics such as race, gender, age, or ethnicity, leading to differences in employment, wages, and access to resources.
What is the difference between statistical and taste-based discrimination?
Statistical discrimination occurs when decisions are based on group-level average characteristics or stereotypes, while taste-based discrimination stems from personal prejudice or bias against a group regardless of individual qualifications.
How does statistical discrimination occur in the labor market?
Statistical discrimination in the labor market occurs when employers use group-level average characteristics, such as race, gender, or age, to make hiring or promotion decisions about individuals, assuming those statistics accurately predict individual productivity or behavior.
What motivates taste-based discrimination?
Taste-based discrimination is motivated by personal prejudices, biases, and preferences against certain groups based on characteristics such as race, ethnicity, gender, or social identity.
What are the consequences of statistical discrimination?
Statistical discrimination leads to unfair treatment of individuals based on group averages, reinforcing stereotypes, perpetuating inequality, reducing job and educational opportunities, and causing inefficiencies in labor and credit markets.
How can taste-based discrimination be identified or measured?
Taste-based discrimination can be identified or measured using audit studies that compare treatment of individuals differing only in non-productive traits such as race or gender, statistical analyses isolating discriminatory effects from productivity-related factors, and field experiments observing differential outcomes in employment, housing, or service provision based on personal characteristics without relevant performance differences.
What policies can address statistical and taste-based discrimination?
Implement anti-discrimination laws, enforce diversity training programs, promote blind hiring practices, increase representation through affirmative action, and mandate transparency in decision-making processes to address statistical and taste-based discrimination.