Microeconometrics focuses on individual-level data, analyzing behaviors and decisions of households, firms, or individuals using cross-sectional or panel datasets. Econometrics broadly covers economic data analysis, incorporating macroeconomic variables and structural models to understand aggregate economic trends. Explore in-depth comparisons and applications to enhance your economic research knowledge.
Main Difference
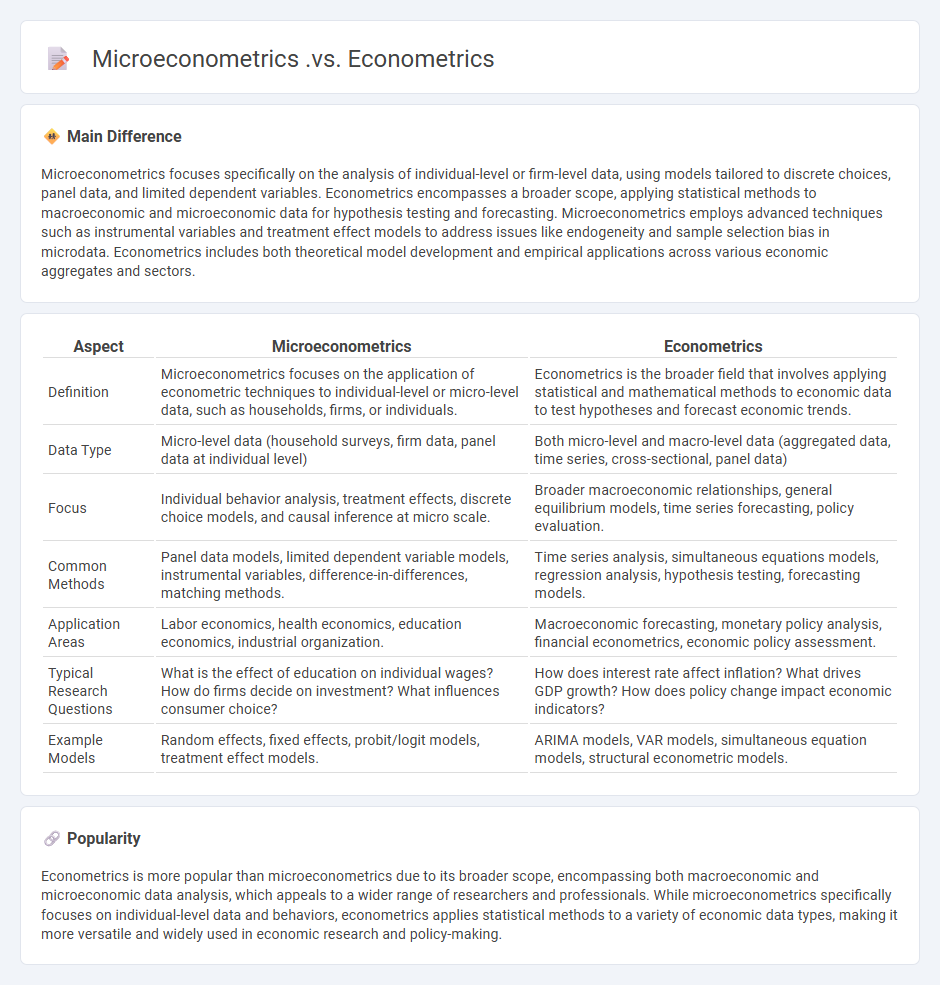
Microeconometrics focuses specifically on the analysis of individual-level or firm-level data, using models tailored to discrete choices, panel data, and limited dependent variables. Econometrics encompasses a broader scope, applying statistical methods to macroeconomic and microeconomic data for hypothesis testing and forecasting. Microeconometrics employs advanced techniques such as instrumental variables and treatment effect models to address issues like endogeneity and sample selection bias in microdata. Econometrics includes both theoretical model development and empirical applications across various economic aggregates and sectors.
Connection
Microeconometrics focuses on analyzing individual or firm-level data using econometric techniques, providing detailed insights into economic behavior. Econometrics encompasses both microeconomic and macroeconomic data analysis, applying statistical methods to estimate economic models and test hypotheses. The connection lies in microeconometrics being a specialized branch of econometrics that deals with micro-level empirical data to understand and quantify economic relationships.
Comparison Table
| Aspect | Microeconometrics | Econometrics |
|---|---|---|
| Definition | Microeconometrics focuses on the application of econometric techniques to individual-level or micro-level data, such as households, firms, or individuals. | Econometrics is the broader field that involves applying statistical and mathematical methods to economic data to test hypotheses and forecast economic trends. |
| Data Type | Micro-level data (household surveys, firm data, panel data at individual level) | Both micro-level and macro-level data (aggregated data, time series, cross-sectional, panel data) |
| Focus | Individual behavior analysis, treatment effects, discrete choice models, and causal inference at micro scale. | Broader macroeconomic relationships, general equilibrium models, time series forecasting, policy evaluation. |
| Common Methods | Panel data models, limited dependent variable models, instrumental variables, difference-in-differences, matching methods. | Time series analysis, simultaneous equations models, regression analysis, hypothesis testing, forecasting models. |
| Application Areas | Labor economics, health economics, education economics, industrial organization. | Macroeconomic forecasting, monetary policy analysis, financial econometrics, economic policy assessment. |
| Typical Research Questions | What is the effect of education on individual wages? How do firms decide on investment? What influences consumer choice? | How does interest rate affect inflation? What drives GDP growth? How does policy change impact economic indicators? |
| Example Models | Random effects, fixed effects, probit/logit models, treatment effect models. | ARIMA models, VAR models, simultaneous equation models, structural econometric models. |
Causal Inference
Causal inference is a statistical approach focused on identifying and estimating cause-and-effect relationships from data. Techniques such as randomized controlled trials, instrumental variables, and propensity score matching help isolate causal effects by controlling for confounding factors. Advanced methods like structural equation modeling and potential outcomes framework allow researchers to draw robust conclusions about causal mechanisms. Accurate causal inference is critical in fields like epidemiology, economics, and social sciences for informed decision-making and policy evaluation.
Individual-Level Data
Individual-level data refers to detailed information collected about single units, such as people, households, or organizations, enabling granular analysis and personalized insights. This type of data includes demographic details, behavior patterns, transaction records, and health metrics, which are critical for sectors like healthcare, marketing, and social sciences. The application of individual-level data supports customized decision-making, predictive modeling, and targeted interventions by capturing specific attributes and interactions unique to each subject. Issues such as privacy, data security, and ethical use are paramount considerations when handling detailed personal information.
Aggregated Data
Aggregated data comprises combined information from multiple sources, summarized to reveal patterns and trends without exposing individual specifics. This technique enhances data analysis efficiency in sectors like finance, healthcare, and marketing by providing holistic insights. Proper aggregation ensures privacy compliance by anonymizing personal details while maintaining data integrity. Businesses leverage aggregated data to optimize strategies, forecast demands, and improve decision-making processes.
Panel Data Analysis
Panel data analysis examines datasets containing observations over multiple time periods for the same entities, enabling researchers to control for individual heterogeneity and detect dynamic changes. This method combines cross-sectional and time-series data, enhancing the accuracy and power of econometric models. Common techniques include fixed effects and random effects models, which account for unobserved variables that vary across entities but remain constant over time. Effective application of panel data analysis improves estimates in fields such as economics, finance, and social sciences by capturing both temporal and individual-specific effects.
Policy Evaluation
Policy evaluation systematically assesses the effectiveness, outcomes, and impacts of public policies using quantitative and qualitative methods. It measures policy performance against predefined objectives, employing tools such as cost-benefit analysis, impact assessment, and stakeholder feedback. Data sources include government reports, surveys, and administrative records to ensure evidence-based conclusions. This process informs decision-makers on policy adjustments, scalability, and accountability.
Source and External Links
The Easy Guide to Micro-Econometrics A Fast Primer - Microeconometrics focuses on analyzing individual-level data such as households or firms using specialized statistical techniques, unlike general econometrics which can include macro-level aggregated data analysis.
What is the difference between macroeconometrics and microeconometrics? - Both microeconometrics and econometrics use similar statistical foundations, but microeconometrics studies microeconomic phenomena at the individual or firm level while econometrics more broadly can include macroeconomic studies.
Macro, Micro and Econometrics | University of Bath - Microeconometrics analyzes data for individual economic units such as consumers or companies, whereas traditional econometrics applies mathematical and statistical inference to economic models at both micro and macro levels for policy and decision making.
FAQs
What is econometrics?
Econometrics is the application of statistical and mathematical methods to analyze economic data for testing hypotheses and forecasting economic trends.
What is microeconometrics?
Microeconometrics is the branch of econometrics that analyzes individual-level data to estimate economic models, focusing on behaviors and outcomes of individuals, households, or firms.
How does microeconometrics differ from econometrics?
Microeconometrics focuses on analyzing individual-level or micro-level data such as households, firms, or workers, using statistical methods tailored for discrete choices, panel data, and limited dependent variables, whereas econometrics broadly applies statistical techniques to economic data at both micro and macro levels to test economic theories and forecast economic trends.
What types of data does microeconometrics use?
Microeconometrics uses cross-sectional data, panel data (longitudinal data), and sometimes repeated cross-sectional data to analyze individual or household-level economic behaviors.
What are key methods used in microeconometrics?
Key methods in microeconometrics include panel data analysis, instrumental variables estimation, difference-in-differences, regression discontinuity designs, and discrete choice models.
What is the main focus of econometrics?
Econometrics primarily focuses on applying statistical and mathematical methods to analyze economic data and test economic theories.
Why is microeconometrics important in research?
Microeconometrics is important in research because it enables accurate analysis of individual-level data to identify causal relationships, improve policy evaluation, and enhance economic modeling precision.