Bottom-up forecasting builds predictions starting from detailed individual data points, aggregating them to form an overall forecast, ensuring granular accuracy. Top-down forecasting begins with high-level aggregate data, then disaggregates projections to finer segments, optimizing efficiency in large-scale analysis. Explore the advantages and applications of each method to enhance your forecasting strategy.
Main Difference
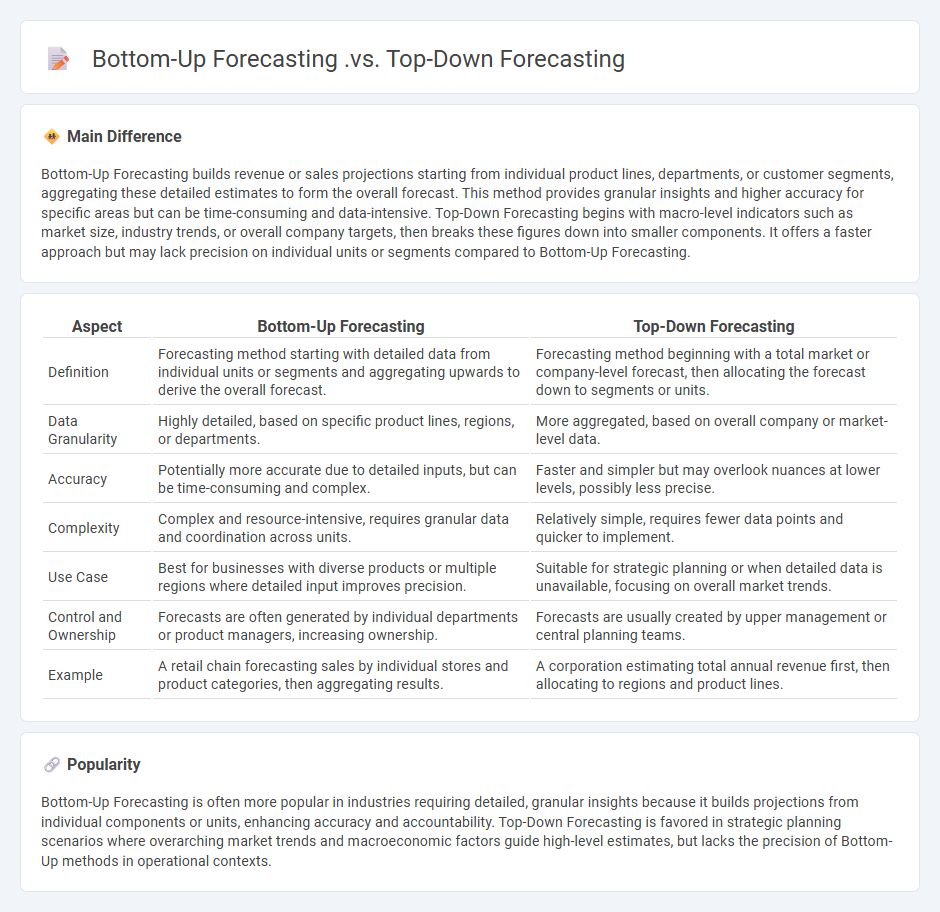
Bottom-Up Forecasting builds revenue or sales projections starting from individual product lines, departments, or customer segments, aggregating these detailed estimates to form the overall forecast. This method provides granular insights and higher accuracy for specific areas but can be time-consuming and data-intensive. Top-Down Forecasting begins with macro-level indicators such as market size, industry trends, or overall company targets, then breaks these figures down into smaller components. It offers a faster approach but may lack precision on individual units or segments compared to Bottom-Up Forecasting.
Connection
Bottom-up forecasting builds detailed predictions by aggregating data from lower-level units such as departments or product lines, forming a comprehensive overall forecast. Top-down forecasting starts with macro-level projections, such as market trends or total company targets, which are then broken down into detailed components for individual units. The connection lies in the iterative feedback loop where bottom-up data validates and refines top-down assumptions, ensuring alignment between granular operational insights and strategic objectives.
Comparison Table
| Aspect | Bottom-Up Forecasting | Top-Down Forecasting |
|---|---|---|
| Definition | Forecasting method starting with detailed data from individual units or segments and aggregating upwards to derive the overall forecast. | Forecasting method beginning with a total market or company-level forecast, then allocating the forecast down to segments or units. |
| Data Granularity | Highly detailed, based on specific product lines, regions, or departments. | More aggregated, based on overall company or market-level data. |
| Accuracy | Potentially more accurate due to detailed inputs, but can be time-consuming and complex. | Faster and simpler but may overlook nuances at lower levels, possibly less precise. |
| Complexity | Complex and resource-intensive, requires granular data and coordination across units. | Relatively simple, requires fewer data points and quicker to implement. |
| Use Case | Best for businesses with diverse products or multiple regions where detailed input improves precision. | Suitable for strategic planning or when detailed data is unavailable, focusing on overall market trends. |
| Control and Ownership | Forecasts are often generated by individual departments or product managers, increasing ownership. | Forecasts are usually created by upper management or central planning teams. |
| Example | A retail chain forecasting sales by individual stores and product categories, then aggregating results. | A corporation estimating total annual revenue first, then allocating to regions and product lines. |
Data Granularity
Data granularity in business refers to the level of detail or depth at which data is captured, stored, and analyzed, ranging from high-level summaries to detailed transactional information. Fine-grained data allows businesses to perform precise customer segmentation, track individual purchase behaviors, and optimize supply chain operations. Coarser data granularity is often used for strategic decision-making, such as trend analysis and forecasting revenue streams. Effective use of appropriate data granularity enhances data-driven insights, supporting operational efficiency and competitive advantage.
Market Segmentation
Market segmentation divides a broad consumer or business market into sub-groups based on shared characteristics such as demographics, geographic location, psychographics, and behavioral patterns. This strategic approach enables companies to tailor products, services, and marketing efforts to meet the specific needs of targeted segments, enhancing customer satisfaction and loyalty. Data analytics and customer profiling tools improve precision in identifying segments with high growth potential and profitability. Leading firms like Procter & Gamble leverage market segmentation to optimize product positioning and drive competitive advantage.
Historical Performance
Historical performance data in business reflects a company's past financial results, including revenue growth, profit margins, and return on investment over specific periods. Analyzing this data helps stakeholders assess the effectiveness of business strategies and operational efficiency, guiding future decision-making. Key performance indicators (KPIs) such as EBITDA, net income, and cash flow trends provide quantitative measures of a company's financial health. Historical performance also influences credit ratings and investor confidence, impacting access to capital and market valuation.
Strategic Planning
Strategic planning in business involves setting long-term goals, analyzing competitive environments, and allocating resources effectively to achieve sustainable growth. Companies utilize frameworks like SWOT analysis and PESTEL analysis to assess internal strengths and external opportunities in dynamic markets. Leading corporations such as Apple and Amazon emphasize continuous strategic evaluation to maintain industry leadership and drive innovation. Effective strategic planning enhances decision-making, aligns organizational objectives, and maximizes shareholder value.
Resource Allocation
Resource allocation in business involves strategically distributing available assets such as capital, labor, and technology to optimize operational efficiency and maximize profit. Effective resource allocation requires analyzing project priorities, market demands, and organizational goals to ensure the right resources support key initiatives. Companies that excel in resource allocation typically improve productivity and maintain competitive advantages by avoiding overextension or resource bottlenecks. Tools like ERP systems and data analytics enhance decision-making, enabling dynamic adjustment to evolving business conditions.
Source and External Links
Top-Down vs Bottom-Up Forecasting: The Complete Guide - Top-down forecasting starts with market and company-level analysis and works downward, offering strategic alignment but less operational detail, while bottom-up begins with detailed sales data, providing precision but sometimes lacking market context; neither is strictly better, and many firms use a hybrid approach.
Top-Down vs. Bottom-Up Forecasting - Top-down forecasting takes a broad market perspective led by management with faster implementation but risks unrealistic expectations, whereas bottom-up relies on detailed, employee-driven input focusing on operational level data for more accurate and grounded forecasts.
Top-Down Vs. Bottom-Up Sales Planning and Forecasting - Top-down forecasting offers time savings and variability suited for early-stage or irregular revenue companies but can be optimistic, while bottom-up forecasting provides realistic, granular, and item-level projections facilitated by employee participation and operational data.
FAQs
What is forecasting in business?
Forecasting in business is the process of estimating future market trends, sales, and financial outcomes using historical data and analytical models to support decision-making.
What is bottom-up forecasting?
Bottom-up forecasting is a method that estimates future outcomes by aggregating detailed data from individual units or components, such as sales at the product or store level, to build an overall forecast.
What is top-down forecasting?
Top-down forecasting is a method where overall market or economic predictions are used to estimate sales and revenue for individual segments or products by breaking down aggregated data.
How do bottom-up and top-down forecasts differ?
Bottom-up forecasts aggregate detailed data from individual units or components to create an overall prediction, while top-down forecasts start with a macro-level estimate and allocate it down to individual parts.
What are the advantages of bottom-up forecasting?
Bottom-up forecasting provides higher accuracy by aggregating detailed data from individual units, improves team accountability through localized input, enhances flexibility by allowing adjustments at the micro level, and fosters better alignment with operational realities.
What are the advantages of top-down forecasting?
Top-down forecasting enables quick estimation based on macro-level data, ensures consistency with overall business goals, facilitates alignment across departments, and simplifies the forecasting process by focusing on aggregate trends before detailing units.
When should you use bottom-up vs. top-down forecasting?
Use bottom-up forecasting when detailed, granular data from individual units or components is available to aggregate accurate overall forecasts; use top-down forecasting when high-level market or industry trends guide predictions and detailed data is limited or unnecessary.