The Efficient Frontier represents the set of optimal portfolios offering the highest expected return for a defined level of risk based on Modern Portfolio Theory. The Capital Market Line (CML) illustrates the risk-return trade-off of efficient portfolios that combine a risk-free asset with the market portfolio. Explore the distinctions between these concepts to enhance your investment strategy decisions.
Main Difference
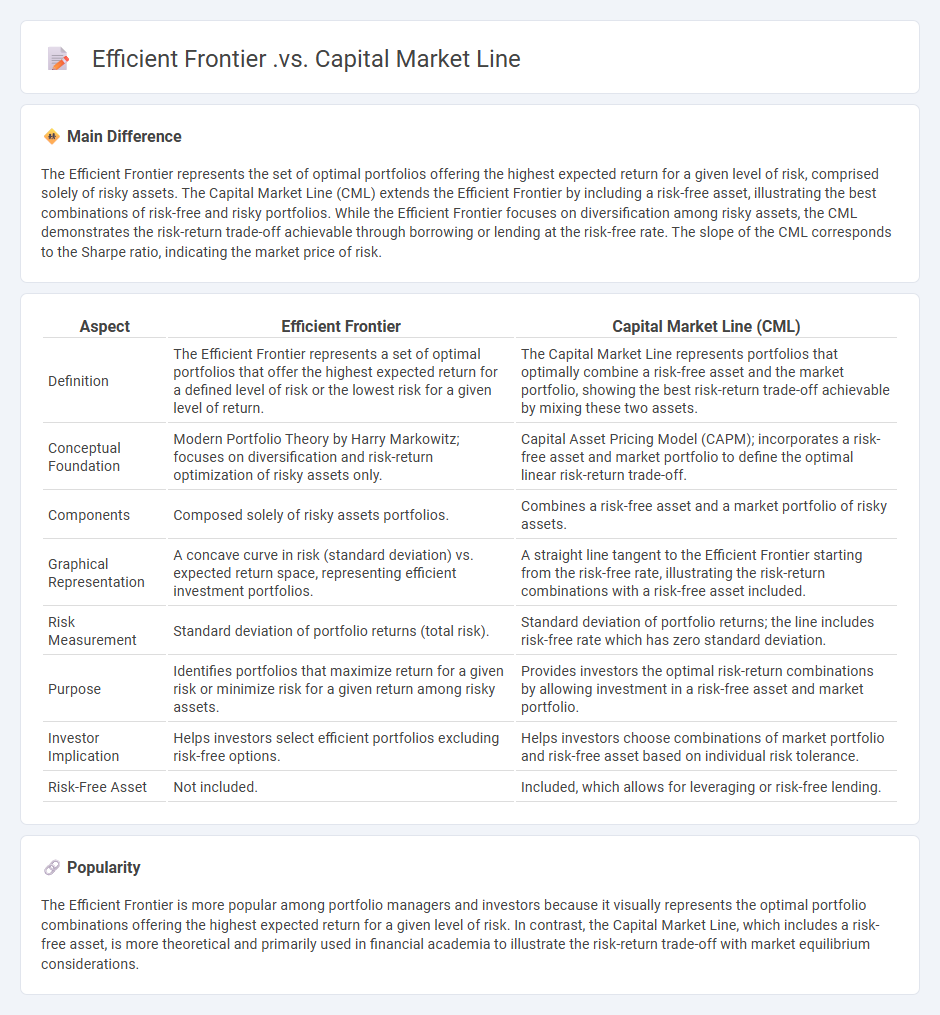
The Efficient Frontier represents the set of optimal portfolios offering the highest expected return for a given level of risk, comprised solely of risky assets. The Capital Market Line (CML) extends the Efficient Frontier by including a risk-free asset, illustrating the best combinations of risk-free and risky portfolios. While the Efficient Frontier focuses on diversification among risky assets, the CML demonstrates the risk-return trade-off achievable through borrowing or lending at the risk-free rate. The slope of the CML corresponds to the Sharpe ratio, indicating the market price of risk.
Connection
The Efficient Frontier represents the set of optimal portfolios offering the highest expected return for a given level of risk, while the Capital Market Line (CML) extends this concept by incorporating a risk-free asset, illustrating the best possible risk-return combinations achievable through a mix of the risk-free asset and the market portfolio. The slope of the CML equals the Sharpe ratio of the market portfolio, indicating the maximum excess return per unit of risk. This connection demonstrates how investors can achieve optimal portfolios by combining the market portfolio on the Efficient Frontier with risk-free borrowing or lending.
Comparison Table
| Aspect | Efficient Frontier | Capital Market Line (CML) |
|---|---|---|
| Definition | The Efficient Frontier represents a set of optimal portfolios that offer the highest expected return for a defined level of risk or the lowest risk for a given level of return. | The Capital Market Line represents portfolios that optimally combine a risk-free asset and the market portfolio, showing the best risk-return trade-off achievable by mixing these two assets. |
| Conceptual Foundation | Modern Portfolio Theory by Harry Markowitz; focuses on diversification and risk-return optimization of risky assets only. | Capital Asset Pricing Model (CAPM); incorporates a risk-free asset and market portfolio to define the optimal linear risk-return trade-off. |
| Components | Composed solely of risky assets portfolios. | Combines a risk-free asset and a market portfolio of risky assets. |
| Graphical Representation | A concave curve in risk (standard deviation) vs. expected return space, representing efficient investment portfolios. | A straight line tangent to the Efficient Frontier starting from the risk-free rate, illustrating the risk-return combinations with a risk-free asset included. |
| Risk Measurement | Standard deviation of portfolio returns (total risk). | Standard deviation of portfolio returns; the line includes risk-free rate which has zero standard deviation. |
| Purpose | Identifies portfolios that maximize return for a given risk or minimize risk for a given return among risky assets. | Provides investors the optimal risk-return combinations by allowing investment in a risk-free asset and market portfolio. |
| Investor Implication | Helps investors select efficient portfolios excluding risk-free options. | Helps investors choose combinations of market portfolio and risk-free asset based on individual risk tolerance. |
| Risk-Free Asset | Not included. | Included, which allows for leveraging or risk-free lending. |
Risk-Return Tradeoff
The risk-return tradeoff is a fundamental principle in business finance that suggests higher potential returns on investment are associated with greater risk. Investors evaluate this balance to make informed decisions, aiming to maximize returns while managing exposure to losses. Quantitative measures such as the Sharpe ratio and beta coefficient help businesses assess and compare risk levels against expected returns. Effective risk management strategies contribute to optimizing this tradeoff, ensuring sustainable growth and financial stability in competitive markets.
Tangency Portfolio
The Tangency Portfolio represents the optimal risky portfolio on the efficient frontier with the highest Sharpe ratio, maximizing return per unit of risk. Constructed using Modern Portfolio Theory, it combines risky assets such that the Capital Market Line touches the efficient frontier at this portfolio point. Investors use the Tangency Portfolio to achieve the best possible expected return for a given level of risk, blending it with a risk-free asset to tailor risk tolerance. Real-world applications include institutional investment strategies aiming to enhance portfolio performance through risk-adjusted returns.
Diversification
Diversification in business refers to the strategic expansion into new markets or product lines to reduce risk and increase growth potential. Companies like Amazon diversified from e-commerce into cloud computing with Amazon Web Services, significantly boosting revenue streams. Effective diversification leverages existing capabilities while exploring related or unrelated industries to enhance overall competitive advantage. This approach mitigates dependence on a single market or product, fostering long-term sustainability.
Sharpe Ratio
The Sharpe Ratio measures risk-adjusted return by comparing an investment's excess return over the risk-free rate to its standard deviation, quantifying how much return is achieved per unit of risk. Widely used in portfolio management, it helps investors identify efficient investments by balancing expected returns against market volatility. Developed by Nobel laureate William F. Sharpe in 1966, it remains a fundamental tool for assessing performance across mutual funds, hedge funds, and stocks. A higher Sharpe Ratio indicates superior risk-adjusted performance, guiding decision-making in asset allocation and risk management strategies.
Market Portfolio
The market portfolio represents a theoretical bundle of all investable assets weighted by their market values, embodying the overall market performance. It serves as a benchmark in the Capital Asset Pricing Model (CAPM) to evaluate an individual asset's risk and expected return. By including equities, bonds, real estate, and other securities, the market portfolio reflects diversified market exposure. Investors use this concept to optimize portfolios and assess systematic risk through beta coefficients.
Source and External Links
Difference between Capital Allocation Line (CAL), Capital Market Line (CML), Security Characteristics Line (SCL), and the Security Market Line (SML) - The efficient frontier shows the best combinations of risky assets for any given risk, while the CML shows the risk-return trade-off achievable by combining the risk-free asset with the optimal market (risky) portfolio.
Capital market line - The CML is the tangent line drawn from the risk-free asset to the market portfolio on the efficient frontier and offers the best risk-return portfolios achievable by investing in both risk-free and risky (market) assets.
Capital Market Theory | CFA Level I Portfolio Management - All investors choose the same optimal risky portfolio (the market portfolio), so the CML represents the unique set of efficient portfolios after adding the risk-free asset to the market, compared to the efficient frontier, which is composed solely of risky assets.
FAQs
What is the efficient frontier in investing?
The efficient frontier in investing is a graph representing portfolios that offer the highest expected return for a given level of risk or the lowest risk for a given expected return, based on Modern Portfolio Theory.
What does the capital market line represent?
The Capital Market Line represents the risk-return tradeoff of efficient portfolios combining a risk-free asset and the market portfolio, illustrating optimal investment combinations with maximum expected return per unit of risk.
How does the efficient frontier differ from the capital market line?
The efficient frontier represents the set of optimal portfolios offering the highest expected return for a given level of risk, while the capital market line (CML) shows the risk-return trade-off achievable by combining the risk-free asset with the market portfolio, illustrating portfolios with the best Sharpe ratios.
What assets are used to construct the efficient frontier?
The efficient frontier is constructed using a portfolio of risky assets, typically including stocks, bonds, and other investable securities with varying expected returns, volatilities, and correlations.
Why is the capital market line considered optimal?
The capital market line is considered optimal because it represents the highest Sharpe ratio, providing the best risk-return tradeoff by combining the risk-free asset with the market portfolio.
How does risk relate to return on the efficient frontier and capital market line?
Risk on the efficient frontier represents the minimum portfolio variance for a given return, while on the capital market line (CML), risk is measured by portfolio standard deviation, and return increases linearly with risk due to the inclusion of the risk-free asset, reflecting the optimal risk-return trade-off in market equilibrium.
What is the role of the risk-free asset in the capital market line?
The risk-free asset serves as the baseline investment in the capital market line, enabling investors to combine it with risky portfolios to optimize expected return per unit of risk.