The Edgeworth box illustrates the distribution and potential trades of two goods between two consumers, highlighting how resources can be efficiently allocated through mutual gains. Indifference curves represent consumer preferences by showing combinations of goods that yield equal satisfaction, allowing the analysis of choice and trade-offs. Explore further to understand how these concepts uniquely contribute to economic theory and market equilibrium.
Main Difference
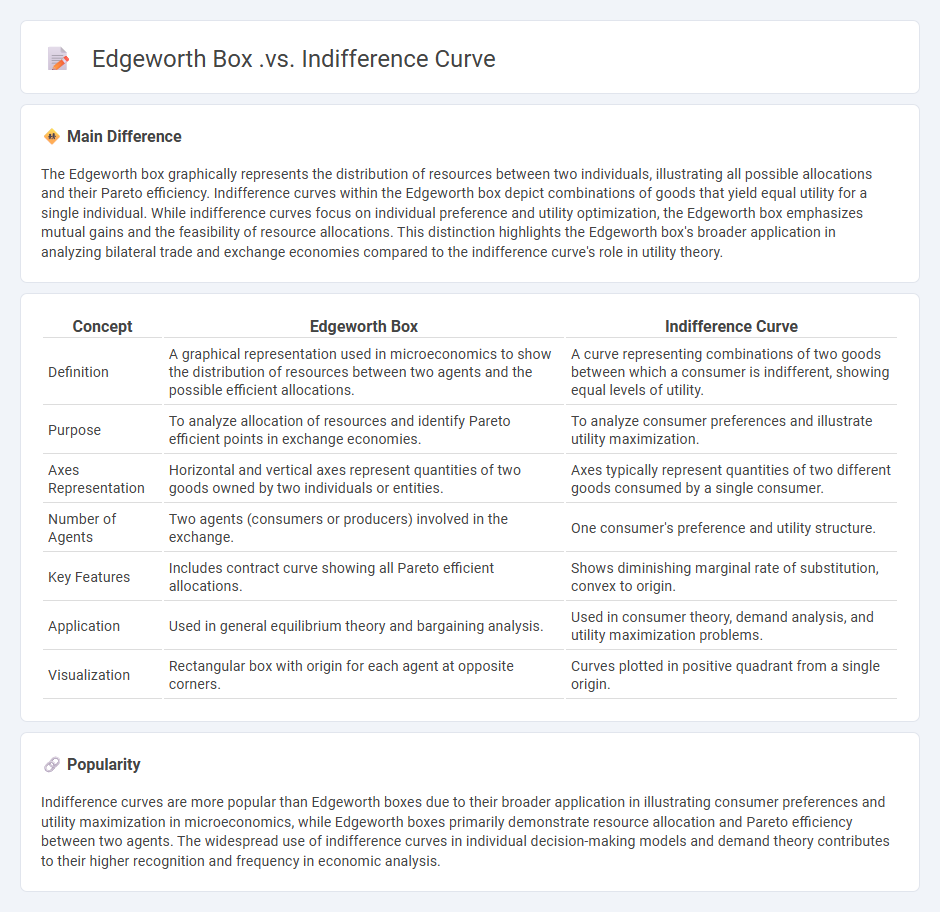
The Edgeworth box graphically represents the distribution of resources between two individuals, illustrating all possible allocations and their Pareto efficiency. Indifference curves within the Edgeworth box depict combinations of goods that yield equal utility for a single individual. While indifference curves focus on individual preference and utility optimization, the Edgeworth box emphasizes mutual gains and the feasibility of resource allocations. This distinction highlights the Edgeworth box's broader application in analyzing bilateral trade and exchange economies compared to the indifference curve's role in utility theory.
Connection
The Edgeworth box graphically represents the distribution of resources and potential trades between two individuals, while indifference curves within the box illustrate each person's preferences over different bundles of goods. The tangency points of indifference curves inside the Edgeworth box identify Pareto efficient allocations where no individual can be made better off without making the other worse off. This connection enables analysis of optimal exchange and equilibrium in microeconomic theory.
Comparison Table
| Concept | Edgeworth Box | Indifference Curve |
|---|---|---|
| Definition | A graphical representation used in microeconomics to show the distribution of resources between two agents and the possible efficient allocations. | A curve representing combinations of two goods between which a consumer is indifferent, showing equal levels of utility. |
| Purpose | To analyze allocation of resources and identify Pareto efficient points in exchange economies. | To analyze consumer preferences and illustrate utility maximization. |
| Axes Representation | Horizontal and vertical axes represent quantities of two goods owned by two individuals or entities. | Axes typically represent quantities of two different goods consumed by a single consumer. |
| Number of Agents | Two agents (consumers or producers) involved in the exchange. | One consumer's preference and utility structure. |
| Key Features | Includes contract curve showing all Pareto efficient allocations. | Shows diminishing marginal rate of substitution, convex to origin. |
| Application | Used in general equilibrium theory and bargaining analysis. | Used in consumer theory, demand analysis, and utility maximization problems. |
| Visualization | Rectangular box with origin for each agent at opposite corners. | Curves plotted in positive quadrant from a single origin. |
Resource Allocation
Resource allocation in economics refers to the efficient distribution of scarce resources among competing uses to maximize productivity and satisfy human needs. It involves decision-making processes that determine how labor, capital, land, and entrepreneurship are assigned across various sectors and industries. Market mechanisms, government interventions, and mixed strategies play critical roles in shaping allocation outcomes and addressing market failures. Optimal resource allocation contributes to economic growth, equitable development, and sustainability by aligning resources with the highest value activities.
Pareto Efficiency
Pareto Efficiency in economics represents a state where resources are allocated in the most efficient manner, making it impossible to improve one individual's well-being without reducing another's. This concept is fundamental in welfare economics and underpins market equilibrium analysis, where supply and demand balance optimally. It is applied to assess economic policies, trade-offs, and distributions, ensuring no waste in resource use. Real-world examples include competitive markets and efficient public goods provision where no alternative allocation can make someone better off without harming another.
Utility Maximization
Utility maximization in economics refers to the process by which consumers allocate their income to purchase a combination of goods and services that maximize their satisfaction or utility. This concept is rooted in the theory of consumer choice, where utility functions represent preferences and budget constraints limit consumption options. The marginal utility per dollar spent is equalized across all goods at the optimal consumption bundle, ensuring efficient resource allocation. Empirical studies use utility maximization to model consumer behavior in markets ranging from retail to digital services.
Contract Curve
The contract curve represents the set of efficient allocations in an Edgeworth box where no individual can be made better off without making another worse off, ensuring Pareto optimality in an exchange economy. It connects points where the marginal rates of substitution between two agents are equal, indicating optimal trade outcomes. The concept is fundamental in understanding negotiation and bargaining solutions in microeconomics. Real-world applications include market equilibrium analysis and welfare economics.
Marginal Rate of Substitution
The Marginal Rate of Substitution (MRS) measures the rate at which a consumer is willing to exchange one good for another while maintaining the same level of utility. It is represented by the slope of the indifference curve at any given point, reflecting consumer preferences and trade-offs. MRS typically diminishes as one moves along the curve, due to the principle of diminishing marginal utility. This concept is fundamental in consumer choice theory and demand analysis in microeconomics.
Source and External Links
Edgeworth Box - The Edgeworth box is a two-dimensional diagram representing an economy with two individuals and two goods; it uses indifference curves to show individuals' preferences over allocations and helps analyze efficiency and possible trades between them.
Edgeworth box - The Edgeworth box graphically displays the total quantities of two goods allocated between two consumers, where each consumer's indifference curves illustrate their preference and efficiency of exchange; it highlights how allocations change through trade starting from an initial endowment.
Preferences over Allocations - Indifference curves in the Edgeworth box represent bundles of goods providing the same utility level to each individual, dividing the choice space into preferred, dispreferred, and indifferent bundles, thus visualizing how each individual evaluates different allocations within the box.
FAQs
What is an Edgeworth box?
An Edgeworth box is a graphical representation used in microeconomics to analyze the distribution of resources and potential gains from trade between two agents with different preferences and initial endowments.
What is an indifference curve?
An indifference curve is a graph representing combinations of two goods that provide a consumer with equal satisfaction or utility.
How does the Edgeworth box represent resource allocation?
The Edgeworth box represents resource allocation by graphically illustrating all possible distributions of two goods between two agents, showing their individual preferences and feasible trades within a fixed total endowment.
How are indifference curves used in the Edgeworth box?
Indifference curves in the Edgeworth box represent each consumer's preference, showing all allocations of two goods providing equal utility, enabling visualization of mutually beneficial trades and identification of the contract curve where allocations are Pareto efficient.
What is the contract curve in the Edgeworth box?
The contract curve in the Edgeworth box represents the set of all Pareto efficient allocations where no agent can be made better off without making the other worse off.
How do you interpret efficiency using indifference curves?
Efficiency is interpreted on indifference curves when a consumer maximizes utility by reaching the highest possible curve tangent to the budget constraint, indicating optimal allocation of resources without waste.
Why is the Edgeworth box important for understanding exchanges?
The Edgeworth box is important for understanding exchanges because it visually represents all possible allocations of goods between two agents, illustrating how mutual gains from trade and Pareto efficiency can be achieved.