The Edgeworth box graphically represents the distribution of resources between two agents, illustrating various allocations within a fixed total endowment. The Pareto frontier identifies the set of allocations where no individual can be made better off without making another worse off, highlighting efficient outcomes. Explore the distinctions and applications of these concepts to deepen your understanding of economic efficiency.
Main Difference
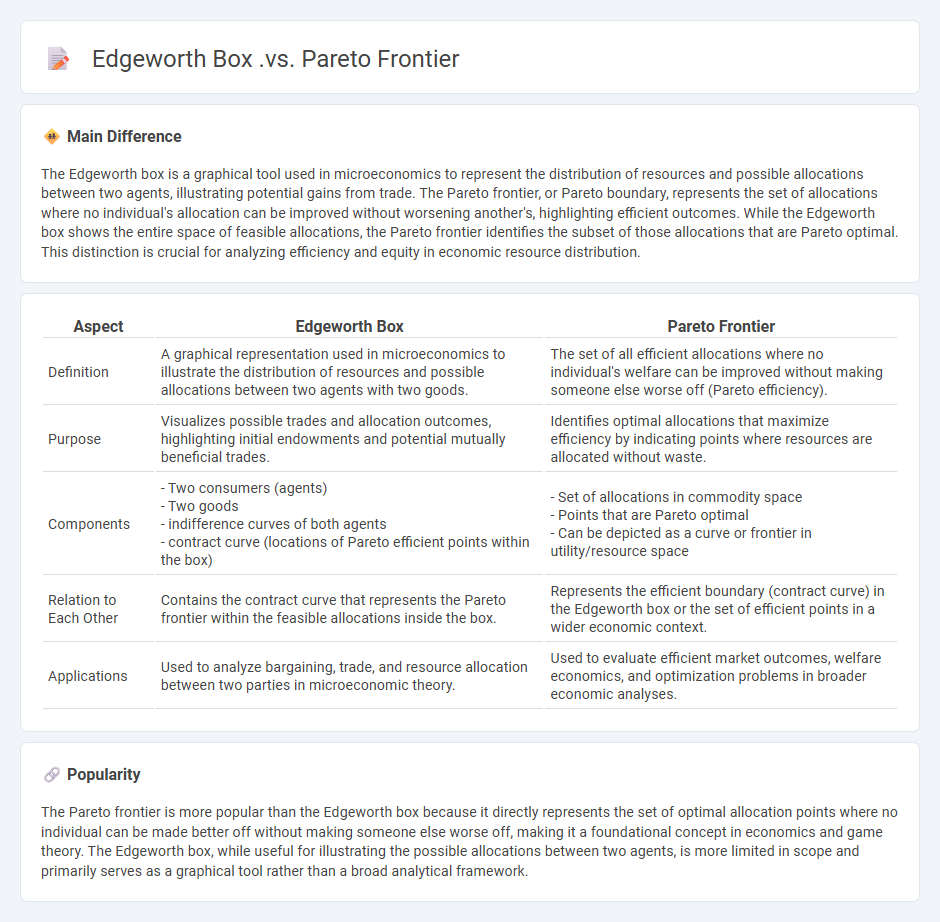
The Edgeworth box is a graphical tool used in microeconomics to represent the distribution of resources and possible allocations between two agents, illustrating potential gains from trade. The Pareto frontier, or Pareto boundary, represents the set of allocations where no individual's allocation can be improved without worsening another's, highlighting efficient outcomes. While the Edgeworth box shows the entire space of feasible allocations, the Pareto frontier identifies the subset of those allocations that are Pareto optimal. This distinction is crucial for analyzing efficiency and equity in economic resource distribution.
Connection
The Edgeworth box visually represents the possible allocations of resources between two parties, illustrating their individual preferences and feasible trades. Within this framework, the Pareto frontier identifies the set of efficient allocations where no party can be made better off without making the other worse off. The intersection of contract curves inside the Edgeworth box effectively maps out the Pareto optimal points, linking the two concepts in resource distribution analysis.
Comparison Table
| Aspect | Edgeworth Box | Pareto Frontier |
|---|---|---|
| Definition | A graphical representation used in microeconomics to illustrate the distribution of resources and possible allocations between two agents with two goods. | The set of all efficient allocations where no individual's welfare can be improved without making someone else worse off (Pareto efficiency). |
| Purpose | Visualizes possible trades and allocation outcomes, highlighting initial endowments and potential mutually beneficial trades. | Identifies optimal allocations that maximize efficiency by indicating points where resources are allocated without waste. |
| Components |
- Two consumers (agents) - Two goods - indifference curves of both agents - contract curve (locations of Pareto efficient points within the box) |
- Set of allocations in commodity space - Points that are Pareto optimal - Can be depicted as a curve or frontier in utility/resource space |
| Relation to Each Other | Contains the contract curve that represents the Pareto frontier within the feasible allocations inside the box. | Represents the efficient boundary (contract curve) in the Edgeworth box or the set of efficient points in a wider economic context. |
| Applications | Used to analyze bargaining, trade, and resource allocation between two parties in microeconomic theory. | Used to evaluate efficient market outcomes, welfare economics, and optimization problems in broader economic analyses. |
Allocative Efficiency
Allocative efficiency occurs when resources in an economy are distributed to produce goods and services most desired by consumers, reflecting optimal consumption patterns. This efficiency is achieved when the marginal cost of production equals the marginal benefit to consumers, ensuring maximum social welfare. Markets with perfect competition often drive allocative efficiency by signaling producer and consumer preferences through price mechanisms. Failure to reach allocative efficiency can result in deadweight loss, where potential gains from trade are not realized.
Indifference Curves
Indifference curves represent combinations of two goods that yield equal levels of utility or satisfaction to a consumer, illustrating consumer preferences without indicating absolute levels of satisfaction. These curves are typically convex to the origin, reflecting the diminishing marginal rate of substitution, meaning consumers are willing to give up less of one good to gain additional units of another. Indifference curve analysis is foundational in microeconomics for understanding consumer choice, budget constraints, and demand functions. Graphical models often pair indifference curves with budget lines to determine optimal consumption bundles that maximize utility given income and prices.
Contract Curve
The Contract Curve in economics represents the set of all efficient allocations where no individual can be made better off without making another worse off, illustrating Pareto optimality in an Edgeworth box. It arises from the intersection of indifference curves between two parties engaged in trade, capturing optimal resource distribution. This curve helps analyze negotiation outcomes and market equilibration by showing mutually beneficial exchanges. Understanding the Contract Curve facilitates insight into welfare economics and the efficient allocation of resources.
Pareto Optimality
Pareto Optimality in economics represents an efficient allocation of resources where no individual can be made better off without making someone else worse off. This concept is fundamental in welfare economics and is used to evaluate economic efficiency in markets and policy decisions. It highlights the trade-offs inherent in resource distribution and serves as a benchmark for identifying potentially beneficial reallocations. Real-world applications include analyzing competitive equilibria, public goods provision, and income distribution to improve social welfare outcomes.
Resource Distribution
Resource distribution in economics involves allocating scarce resources such as labor, capital, and raw materials across various sectors to maximize efficiency and output. Market economies rely on price mechanisms to signal supply and demand, guiding resource allocation toward productive uses, while planned economies use centralized directives for distribution. Understanding the impact of income inequality, resource scarcity, and technological innovation is crucial for optimizing distribution strategies. Effective resource allocation enhances economic growth, reduces waste, and addresses social welfare objectives.
Source and External Links
Review of eco 310 - general equilibrium and pareto efficiency - The Edgeworth box graphically represents allocations between two agents, where Pareto efficient points are characterized by tangency of their indifference curves, meaning no further mutually beneficial trades are possible within the box.
Social Preferences and Equity - EconGraphs - The Pareto frontier (or contract curve) within the Edgeworth box is the set of allocations where one agent's utility cannot be increased without decreasing the other's, defining the boundary of feasible utility combinations.
Edgeworth box - Wikipedia - The Edgeworth box is a graphical tool showing all possible allocations of two goods between two consumers, and Pareto efficient allocations lie along the contract curve where their indifference curves are tangent and no further exchanges can benefit both parties.
FAQs
What is an Edgeworth box?
An Edgeworth box is a graphical representation used in microeconomics to analyze the distribution of resources and the efficiency of trade between two individuals with fixed total endowments.
What is a Pareto frontier?
A Pareto frontier is the set of optimal solutions in multi-objective optimization where no objective can be improved without worsening another.
How does the Edgeworth box illustrate exchange?
The Edgeworth box visually illustrates exchange by showing all possible allocations of two goods between two individuals, where each point inside the box represents a distribution and the contract curve indicates mutually beneficial trades leading to Pareto efficient outcomes.
How does the Pareto frontier represent efficiency?
The Pareto frontier represents efficiency by illustrating the set of optimal solutions where no objective can be improved without worsening another, indicating maximum resource utilization.
What is the relationship between the Edgeworth box and Pareto optimality?
The Edgeworth box visually represents all possible allocations of two goods between two agents, and Pareto optimality corresponds to points on the contract curve within the box where no agent's utility can be increased without decreasing the other's utility.
How do indifference curves function within an Edgeworth box?
Indifference curves within an Edgeworth box illustrate each consumer's preference combinations of two goods, identifying allocations where the consumer attains equal utility, and their tangencies represent potential Pareto efficient exchanges.
How is the Pareto frontier derived from the Edgeworth box?
The Pareto frontier in the Edgeworth box is derived by identifying all allocations where the indifference curves of the two agents are tangent, indicating no further mutually beneficial trades are possible.