The Edgeworth box illustrates the allocation of resources and potential gains from trade between two agents with fixed total endowments, emphasizing the concepts of Pareto efficiency and contract curves in a two-good, two-agent exchange economy. The Walrasian equilibrium, on the other hand, extends these ideas to a broader market setting, where prices adjust to equilibrate supply and demand across multiple goods and agents, leading to a state where no participant can improve their utility given the price system. Explore further to understand how these foundational concepts shape modern general equilibrium theory and market efficiency.
Main Difference
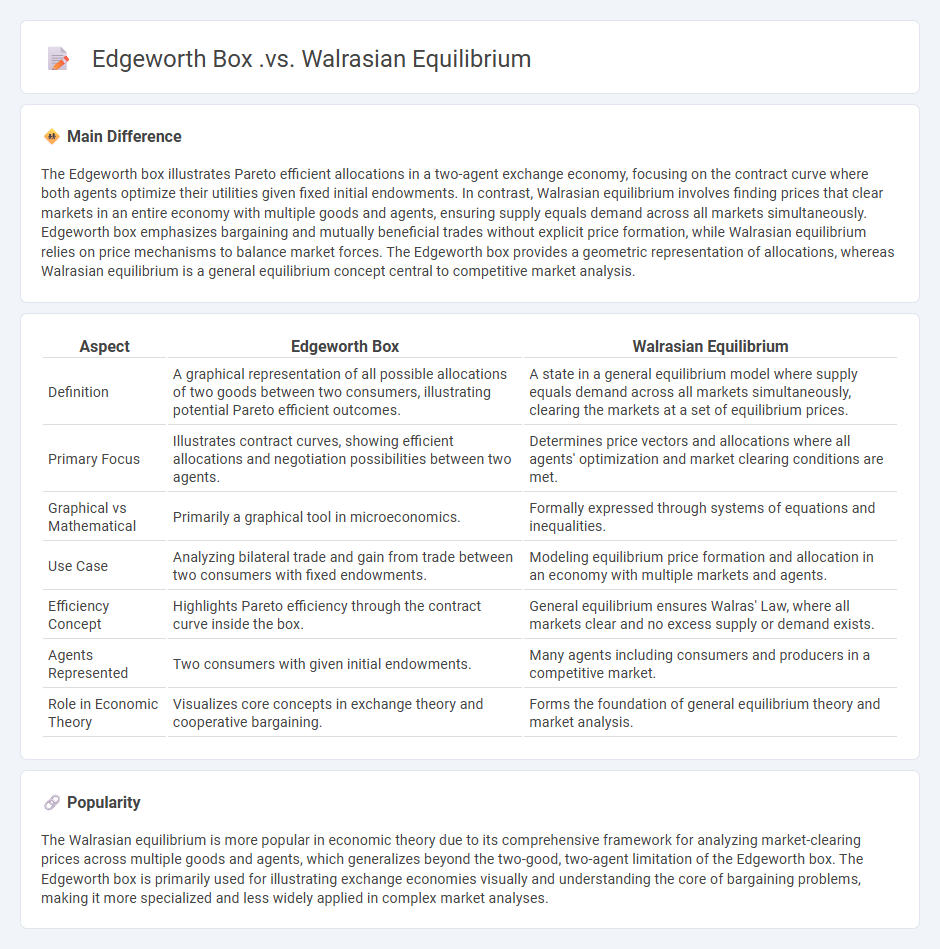
The Edgeworth box illustrates Pareto efficient allocations in a two-agent exchange economy, focusing on the contract curve where both agents optimize their utilities given fixed initial endowments. In contrast, Walrasian equilibrium involves finding prices that clear markets in an entire economy with multiple goods and agents, ensuring supply equals demand across all markets simultaneously. Edgeworth box emphasizes bargaining and mutually beneficial trades without explicit price formation, while Walrasian equilibrium relies on price mechanisms to balance market forces. The Edgeworth box provides a geometric representation of allocations, whereas Walrasian equilibrium is a general equilibrium concept central to competitive market analysis.
Connection
The Edgeworth box visually represents the allocation of resources between two agents in a pure exchange economy, illustrating all possible Pareto efficient allocations. Walrasian equilibrium corresponds to a point within the Edgeworth box where supply equals demand, and both agents maximize utility given market prices. This equilibrium concept connects individual optimization with market-clearing prices, linking the geometric intuition of the Edgeworth box to the formal price mechanism of general equilibrium theory.
Comparison Table
| Aspect | Edgeworth Box | Walrasian Equilibrium |
|---|---|---|
| Definition | A graphical representation of all possible allocations of two goods between two consumers, illustrating potential Pareto efficient outcomes. | A state in a general equilibrium model where supply equals demand across all markets simultaneously, clearing the markets at a set of equilibrium prices. |
| Primary Focus | Illustrates contract curves, showing efficient allocations and negotiation possibilities between two agents. | Determines price vectors and allocations where all agents' optimization and market clearing conditions are met. |
| Graphical vs Mathematical | Primarily a graphical tool in microeconomics. | Formally expressed through systems of equations and inequalities. |
| Use Case | Analyzing bilateral trade and gain from trade between two consumers with fixed endowments. | Modeling equilibrium price formation and allocation in an economy with multiple markets and agents. |
| Efficiency Concept | Highlights Pareto efficiency through the contract curve inside the box. | General equilibrium ensures Walras' Law, where all markets clear and no excess supply or demand exists. |
| Agents Represented | Two consumers with given initial endowments. | Many agents including consumers and producers in a competitive market. |
| Role in Economic Theory | Visualizes core concepts in exchange theory and cooperative bargaining. | Forms the foundation of general equilibrium theory and market analysis. |
Pareto Efficiency
Pareto Efficiency represents an economic state where resources are allocated in a way that no individual can be made better off without making someone else worse off. This concept, introduced by economist Vilfredo Pareto, is fundamental in welfare economics and optimal resource distribution. Markets reaching Pareto Optimality indicate efficient outcomes, though they may not ensure equity or fairness in distribution. Economists analyze Pareto improvements to evaluate policy changes that can benefit at least one party without harming others.
Contract Curve
The contract curve represents all Pareto-efficient allocations of resources between two parties in an edgeworth box, where no individual can be made better off without making the other worse off. It is derived by finding points of tangency between the indifference curves of the two agents, indicating mutually beneficial trades. The curve illustrates the set of optimal agreements that rational economic agents can reach through negotiation or exchange. In competitive markets, the contract curve defines the space of allocations consistent with efficient outcomes.
General Equilibrium
General Equilibrium in economics analyzes how supply and demand interact across multiple markets to determine prices and resource allocation simultaneously. It models the interdependence of markets, showing how changes in one sector affect others through price adjustments, leading to an overall balance in the economy. The Arrow-Debreu model provides a foundational framework for proving the existence of equilibrium under certain conditions, assuming perfect competition and complete markets. Practical applications include welfare economics, policy design, and understanding systemic risk in interconnected financial systems.
Excess Demand Function
Excess demand function quantifies the difference between quantity demanded and quantity supplied for a specific good at various price levels, capturing market imbalances. It is mathematically represented as \( Z(p) = D(p) - S(p) \), where \( D(p) \) denotes demand and \( S(p) \) denotes supply at price \( p \). When \( Z(p) > 0 \), excess demand indicates upward pressure on prices, while \( Z(p) < 0 \) signifies surplus and downward price pressure. This function is crucial in general equilibrium theory and helps determine equilibrium prices where excess demand equals zero.
Competitive Allocations
Competitive allocations refer to the distribution of resources or goods among agents in a market where prices adjust to balance supply and demand. This concept is fundamental in general equilibrium theory, where competitive markets achieve efficient outcomes under certain assumptions, such as perfect competition and complete markets. The First Welfare Theorem states that any competitive equilibrium allocation is Pareto efficient, implying no individual can be made better off without making another worse off. Empirical studies in economics utilize competitive allocation models to analyze market behavior and resource optimization in diverse industries.
Source and External Links
EC9D3 Advanced Microeconomics, Part I: Lecture 6 - The Edgeworth box is a graphical tool to represent allocations between two consumers, and the Walrasian equilibrium within it is defined as a price vector and allocation where both consumers maximize their utility given budget constraints and total resources, corresponding to the tangency of their indifference curves and the intersection of offer curves.
Edgeworth box - The Edgeworth box visually depicts the distribution of two goods between two consumers and their indifference curves, helping illustrate initial endowments, exchanges, and the concept of competitive (Walrasian) equilibrium where a price and allocation pair satisfy market clearing and mutual utility optimization.
General Equilibrium - Walrasian equilibrium in the Edgeworth box context refers to a competitive equilibrium price and allocation that is Pareto optimal, lying on the contract curve within the box, with the First Welfare Theorem guaranteeing that any Walrasian equilibrium allocation is Pareto efficient.
FAQs
What is an Edgeworth Box?
The Edgeworth Box is a graphical tool in microeconomics that represents the distribution of resources and possible allocations between two agents, illustrating concepts of efficiency and trade-offs in a fixed-resource economy.
What does a Walrasian equilibrium represent?
A Walrasian equilibrium represents a state in a competitive market where supply equals demand across all goods, and all agents optimize their utility or profit given prices.
How are allocations shown in the Edgeworth Box?
Allocations in the Edgeworth Box are shown as points within the box representing the quantities of two goods allocated between two consumers.
What is the relationship between the Edgeworth Box and Pareto efficiency?
The Edgeworth Box visually represents all possible allocations between two agents, where Pareto efficiency corresponds to points along the contract curve inside the box, indicating allocations where no agent can be made better off without making the other worse off.
How does the Walrasian equilibrium ensure market clearing?
The Walrasian equilibrium ensures market clearing by setting prices so that aggregate demand equals aggregate supply for every good, eliminating excess demand or surplus in all markets simultaneously.
In what way does the Edgeworth Box illustrate gains from trade?
The Edgeworth Box illustrates gains from trade by showing how two parties can mutually increase their utility through voluntary exchange, moving from an initial allocation inside the box to a contract curve where both reach higher indifference curves.
Can every Edgeworth Box equilibrium be replicated by Walrasian equilibrium?
Not every Edgeworth Box equilibrium can be replicated by a Walrasian equilibrium; only Pareto-efficient allocations that satisfy market-clearing and price-taking conditions correspond to Walrasian equilibria.