Stochastic dominance evaluates investment choices by comparing entire probability distributions of returns, offering a more comprehensive risk assessment than mean-variance analysis, which focuses solely on expected returns and variance. This method is particularly useful for investors seeking robust decision criteria under uncertainty without strictly adhering to mean-variance preferences. Explore further to understand how stochastic dominance enhances portfolio optimization beyond traditional mean-variance frameworks.
Main Difference
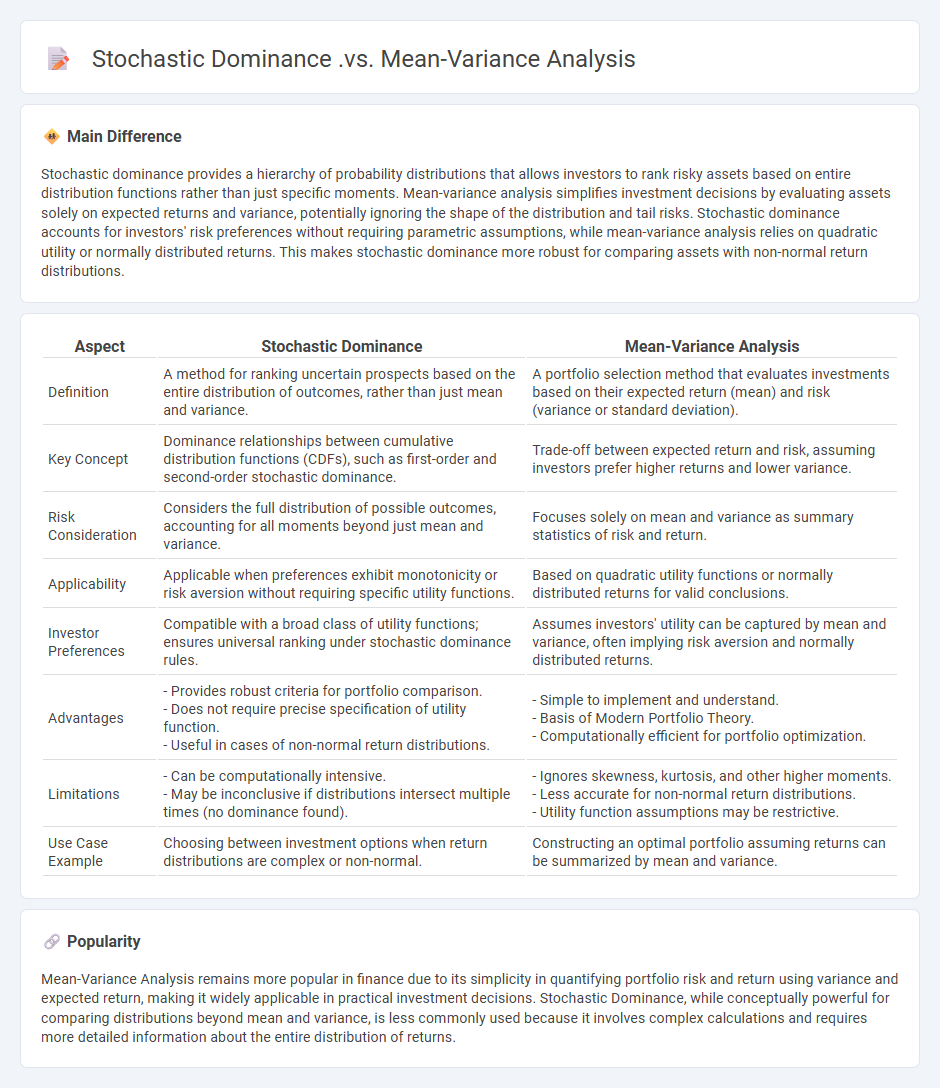
Stochastic dominance provides a hierarchy of probability distributions that allows investors to rank risky assets based on entire distribution functions rather than just specific moments. Mean-variance analysis simplifies investment decisions by evaluating assets solely on expected returns and variance, potentially ignoring the shape of the distribution and tail risks. Stochastic dominance accounts for investors' risk preferences without requiring parametric assumptions, while mean-variance analysis relies on quadratic utility or normally distributed returns. This makes stochastic dominance more robust for comparing assets with non-normal return distributions.
Connection
Stochastic dominance provides a hierarchy of distributions to rank uncertain prospects beyond mean and variance by capturing entire distribution shapes, while mean-variance analysis simplifies risk preferences into average return and variability metrics. Both methods inform investment decisions with stochastic dominance offering a more comprehensive ordering of portfolios, and mean-variance focusing on concave utility functions through two moment summaries. The connection lies in stochastic dominance encompassing mean-variance criteria as special cases, linking expected utility theory with quadratic approximations of risk-return trade-offs.
Comparison Table
| Aspect | Stochastic Dominance | Mean-Variance Analysis |
|---|---|---|
| Definition | A method for ranking uncertain prospects based on the entire distribution of outcomes, rather than just mean and variance. | A portfolio selection method that evaluates investments based on their expected return (mean) and risk (variance or standard deviation). |
| Key Concept | Dominance relationships between cumulative distribution functions (CDFs), such as first-order and second-order stochastic dominance. | Trade-off between expected return and risk, assuming investors prefer higher returns and lower variance. |
| Risk Consideration | Considers the full distribution of possible outcomes, accounting for all moments beyond just mean and variance. | Focuses solely on mean and variance as summary statistics of risk and return. |
| Applicability | Applicable when preferences exhibit monotonicity or risk aversion without requiring specific utility functions. | Based on quadratic utility functions or normally distributed returns for valid conclusions. |
| Investor Preferences | Compatible with a broad class of utility functions; ensures universal ranking under stochastic dominance rules. | Assumes investors' utility can be captured by mean and variance, often implying risk aversion and normally distributed returns. |
| Advantages | - Provides robust criteria for portfolio comparison. - Does not require precise specification of utility function. - Useful in cases of non-normal return distributions. |
- Simple to implement and understand. - Basis of Modern Portfolio Theory. - Computationally efficient for portfolio optimization. |
| Limitations | - Can be computationally intensive. - May be inconclusive if distributions intersect multiple times (no dominance found). |
- Ignores skewness, kurtosis, and other higher moments. - Less accurate for non-normal return distributions. - Utility function assumptions may be restrictive. |
| Use Case Example | Choosing between investment options when return distributions are complex or non-normal. | Constructing an optimal portfolio assuming returns can be summarized by mean and variance. |
Risk Preferences
Risk preferences in economics refer to an individual's or entity's attitude toward uncertainty when making decisions involving potential gains or losses. These preferences are typically categorized as risk-averse, risk-neutral, or risk-seeking based on how decision-makers evaluate expected utility versus potential variability. Behavioral economics incorporates models such as Prospect Theory to better explain deviations from classical expected utility theory by highlighting loss aversion and reference dependence. Quantitative measures of risk preferences, like the Arrow-Pratt coefficient of relative risk aversion, provide critical inputs for financial modeling, insurance design, and portfolio optimization.
Utility Function
A utility function in economics represents a consumer's preference ranking over a set of goods or services, quantifying satisfaction or happiness derived from consumption. It is a mathematical tool used in microeconomic theory to analyze decision-making behavior under constraints. Utility functions help in predicting consumer choices, optimizing resource allocation, and understanding demand elasticity. Common forms include Cobb-Douglas, CES (Constant Elasticity of Substitution), and quasilinear utility functions.
Portfolio Selection
Portfolio selection involves choosing a combination of financial assets to maximize returns while minimizing risk, based on the investor's risk tolerance and investment goals. Modern Portfolio Theory, introduced by Harry Markowitz in 1952, established the foundation by quantifying risk through portfolio variance and identifying efficient frontiers. Empirical studies demonstrate that diversification reduces unsystematic risk, enhancing portfolio performance in various economic conditions. Asset allocation strategies incorporate equities, bonds, and alternative investments to optimize expected returns adjusted for volatility and correlations.
Dominance Criterion
The Dominance Criterion in economics is a decision rule used to compare different strategies or choices by evaluating their outcomes. It states that one option dominates another if it yields better or equal results in all scenarios and strictly better results in at least one scenario. This criterion is essential in game theory and decision analysis, often simplifying complex problems by eliminating dominated strategies. Economists apply it to optimize choices in markets, auctions, and bargaining situations, ensuring rational decision-making under uncertainty.
Distribution Assumptions
Distribution assumptions in economics refer to the theoretical premises about how income, wealth, or resources are shared among individuals or groups within an economy. These assumptions influence models predicting economic behavior, market outcomes, and policy impacts by defining initial endowments and inequality levels. Key models include the Lorenz curve and Gini coefficient, which quantify income distribution, while assumptions vary from equal distribution to power-law distributions seen in wealth. Accurate distribution assumptions are essential for assessing economic growth, social welfare, and the redistributive effects of taxation.
Source and External Links
Mean-variance versus stochastic dominance - Mean-variance analysis and stochastic dominance often identify similar efficient investments, but third-order stochastic dominance (TSD) excludes high-volatility investments and can lead to different rankings, penalizing assets with negative skewness and low kurtosis that mean-variance ignores.
Comparing Mean Variance Tests with Stochastic Dominance When Assessing International Portfolio Diversification Benefits - Stochastic dominance is theoretically superior to mean-variance because it considers the entire return distribution and relies on less restrictive assumptions about investor preferences, sometimes leading to conclusions that contradict mean-variance results.
A discussion of stochastic dominance and mean-risk optimal portfolio problems based on mean-variance-mixture models - Under normal mean-variance mixture models, mean-risk frontier portfolios can be derived in closed form by solving a mean-variance optimization with an adjusted return vector, linking stochastic dominance and mean-variance approaches for specific distributional assumptions.
FAQs
What is stochastic dominance in finance?
Stochastic dominance in finance is a statistical method used to compare and rank investment portfolios or assets based on their entire return distributions, identifying which one provides higher expected utility for all risk-averse investors.
How does mean-variance analysis work?
Mean-variance analysis evaluates investment portfolios by quantifying expected returns (mean) and associated risks (variance) to optimize asset allocation for maximum return at a given risk level.
What are the main differences between stochastic dominance and mean-variance analysis?
Stochastic dominance compares full probability distributions to rank uncertain prospects based on all moments, while mean-variance analysis evaluates investments using only the first two moments--mean and variance--assuming a quadratic utility or normal distribution.
When is stochastic dominance preferred over mean-variance analysis?
Stochastic dominance is preferred over mean-variance analysis when investors seek to rank investments based on entire return distributions without assuming specific utility functions or normality, especially under non-normal, skewed, or heavy-tailed return profiles.
What are the limitations of mean-variance analysis?
Mean-variance analysis assumes normally distributed returns, relies solely on expected return and variance, ignores higher moments like skewness and kurtosis, presumes investors are rational and risk-averse, and depends on accurate estimation of inputs which can be unstable and lead to suboptimal portfolios.
How does stochastic dominance address risk differently?
Stochastic dominance addresses risk by ranking distributions based on entire cumulative distribution functions rather than specific moments or measures, enabling preference ordering for all risk-averse decision-makers without relying on expected utility values.
In which situations do both methods provide similar investment choices?
Both methods provide similar investment choices when market conditions are stable, asset correlations remain constant, and risk-return profiles align closely.