Cap Table details ownership stakes and equity distribution among investors, founders, and employees, providing a clear snapshot of company ownership percentages and dilution effects. Waterfall Analysis models the distribution of proceeds during liquidity events, outlining the order and amounts paid to different classes of shareholders based on preferences and seniority. Explore the nuances of Cap Table and Waterfall Analysis to better understand equity management and investor returns.
Main Difference
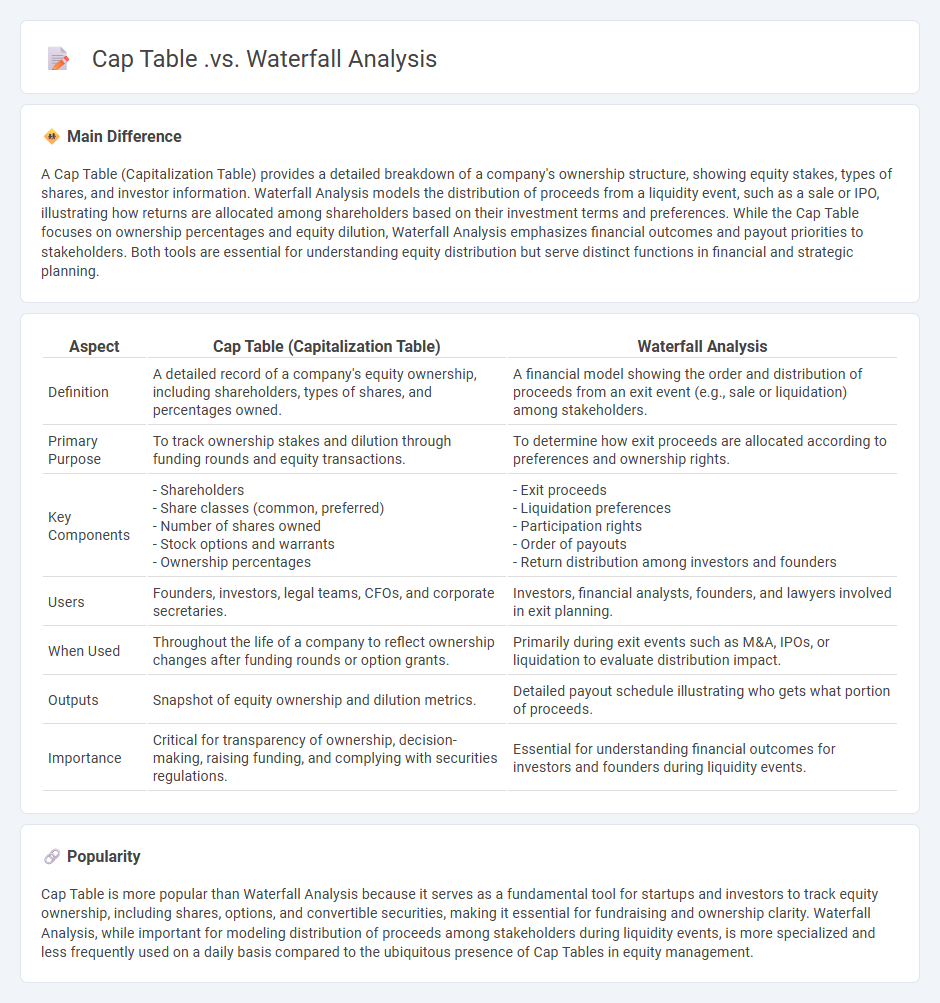
A Cap Table (Capitalization Table) provides a detailed breakdown of a company's ownership structure, showing equity stakes, types of shares, and investor information. Waterfall Analysis models the distribution of proceeds from a liquidity event, such as a sale or IPO, illustrating how returns are allocated among shareholders based on their investment terms and preferences. While the Cap Table focuses on ownership percentages and equity dilution, Waterfall Analysis emphasizes financial outcomes and payout priorities to stakeholders. Both tools are essential for understanding equity distribution but serve distinct functions in financial and strategic planning.
Connection
Cap table and waterfall analysis are connected through their shared role in equity management and distribution. A cap table details the ownership stakes, types of equity, and investor hierarchy, while waterfall analysis models the sequence and priority of payouts to these stakeholders during liquidity events. Together, they provide a comprehensive view of how equity ownership translates into financial returns under various exit scenarios.
Comparison Table
| Aspect | Cap Table (Capitalization Table) | Waterfall Analysis |
|---|---|---|
| Definition | A detailed record of a company's equity ownership, including shareholders, types of shares, and percentages owned. | A financial model showing the order and distribution of proceeds from an exit event (e.g., sale or liquidation) among stakeholders. |
| Primary Purpose | To track ownership stakes and dilution through funding rounds and equity transactions. | To determine how exit proceeds are allocated according to preferences and ownership rights. |
| Key Components |
- Shareholders - Share classes (common, preferred) - Number of shares owned - Stock options and warrants - Ownership percentages |
- Exit proceeds - Liquidation preferences - Participation rights - Order of payouts - Return distribution among investors and founders |
| Users | Founders, investors, legal teams, CFOs, and corporate secretaries. | Investors, financial analysts, founders, and lawyers involved in exit planning. |
| When Used | Throughout the life of a company to reflect ownership changes after funding rounds or option grants. | Primarily during exit events such as M&A, IPOs, or liquidation to evaluate distribution impact. |
| Outputs | Snapshot of equity ownership and dilution metrics. | Detailed payout schedule illustrating who gets what portion of proceeds. |
| Importance | Critical for transparency of ownership, decision-making, raising funding, and complying with securities regulations. | Essential for understanding financial outcomes for investors and founders during liquidity events. |
Equity Ownership
Equity ownership represents the percentage of a company's shares held by an individual or entity, granting them ownership rights and potential dividends. It determines voting power in corporate decisions, influencing the direction and management of a business. Types of equity ownership include common stock, preferred stock, and private equity stakes. Major shareholders often include founders, institutional investors, and venture capitalists, whose stakes impact company valuation and governance.
Share Dilution
Share dilution occurs when a company issues additional shares, reducing the ownership percentage of existing shareholders. It frequently happens during new equity financing rounds, stock option exercises, or convertible debt conversions. This dilution can impact earnings per share (EPS) and voting power, potentially affecting shareholder value. Companies often balance the need for capital with the risk of diluting existing shareholders' stakes.
Distribution Sequence
A distribution sequence in business refers to the strategic order in which products or services are delivered from manufacturers to end consumers, optimizing supply chain efficiency. This sequence encompasses various channels such as wholesalers, retailers, and direct sales, tailored to market demand and geographic factors. Effective distribution sequencing reduces operational costs, enhances customer satisfaction, and improves market penetration by ensuring timely availability of products. Understanding consumer behavior and leveraging technology like inventory management systems further refines this process for competitive advantage.
Exit Proceeds
Exit proceeds represent the total financial returns a business owner or investor receives from the sale or liquidation of a company. These proceeds include cash payments, stock distributions, and any other forms of compensation realized during an exit event such as an acquisition, merger, or initial public offering (IPO). Accurate calculation of exit proceeds is crucial for determining shareholder value and guiding future investment decisions. In 2023, exit proceeds in global mergers and acquisitions totaled over $4 trillion, reflecting the scale of capital flows in business exits.
Stakeholder Payouts
Stakeholder payouts in business refer to the distribution of financial returns or benefits to parties with vested interests in the company, such as shareholders, employees, creditors, and suppliers. Shareholders receive dividends based on company profits and stock holdings, while employees may benefit from profit-sharing programs or bonuses. Creditors are paid through interest and principal repayments, ensuring the company meets its debt obligations. Effective stakeholder payout strategies enhance company reputation, promote investment, and support sustainable growth.
Source and External Links
Mastering Waterfall Analysis in Cap Tables: A Comprehensive Guide - A cap table details ownership stakes and equity types, while waterfall analysis models how exit proceeds are distributed among stakeholders considering ownership rights and seniority of claims, providing insight into potential returns during liquidity events.
Waterfall Analysis and Cap Table: Determining Equity Distribution - The cap table shows the accounting ownership and equity securities of a company, whereas waterfall analysis uses assumptions to calculate the actual proceeds each shareholder would receive in liquidation, reflecting the financial outcomes beyond mere ownership percentages.
Understanding Cap Table Waterfalls: Analysis, Modeling, and Distribution - Waterfall analysis is a model applied atop the cap table to prioritize payouts in exit events, honoring liquidation preferences and rights of preferred versus common shareholders, thereby simulating how proceeds flow in different exit scenarios.
FAQs
What is a cap table?
A cap table, or capitalization table, is a detailed spreadsheet or document that outlines the ownership stakes, equity dilution, and value of shares in a company, typically used by startups to track founders', investors', and employees' equity percentages.
What is a waterfall analysis?
A waterfall analysis visually breaks down a starting value by sequentially adding or subtracting factors to explain the net change leading to an ending value.
How is a cap table different from a waterfall analysis?
A cap table details company ownership percentages, equity dilution, and shareholder information, while a waterfall analysis models the distribution of proceeds among investors and stakeholders based on exit scenarios and payout priorities.
What information does a cap table show?
A cap table shows ownership percentages, equity dilution, investor types, and share classes within a company.
What is the purpose of a waterfall analysis?
Waterfall analysis identifies incremental impacts of individual factors on a total change, clarifying complex financial or business performance variations step-by-step.
How do cap tables support investment decisions?
Cap tables provide clear ownership percentages and equity dilution details, enabling investors to assess valuation, control distribution, and potential return on investment accurately.
How does a waterfall analysis impact payout distributions?
A waterfall analysis structures payout distributions by prioritizing the sequential allocation of funds, ensuring senior stakeholders are paid first before subordinate levels receive distributions.