Deadweight loss represents the total loss of economic efficiency when market equilibrium is not achieved, often due to taxes, subsidies, or price controls. The Harberger triangle specifically quantifies this loss in welfare, depicting the deadweight loss graphically as a triangle on supply and demand charts. Explore our detailed analysis to understand the differences and implications of deadweight loss and the Harberger triangle further.
Main Difference
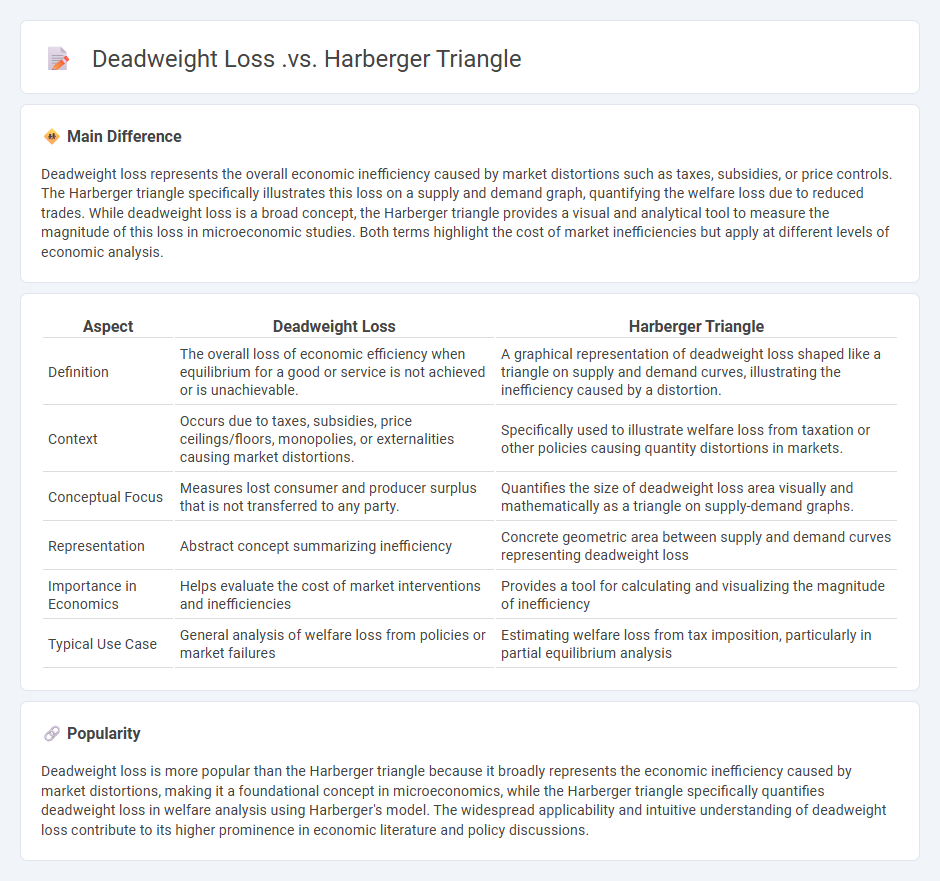
Deadweight loss represents the overall economic inefficiency caused by market distortions such as taxes, subsidies, or price controls. The Harberger triangle specifically illustrates this loss on a supply and demand graph, quantifying the welfare loss due to reduced trades. While deadweight loss is a broad concept, the Harberger triangle provides a visual and analytical tool to measure the magnitude of this loss in microeconomic studies. Both terms highlight the cost of market inefficiencies but apply at different levels of economic analysis.
Connection
Deadweight loss represents the loss of economic efficiency when market equilibrium is not achieved, often due to taxes, subsidies, or price controls. The Harberger triangle visually illustrates this deadweight loss on a supply and demand graph, showing the reduction in total surplus caused by market distortions. This triangular area quantifies the inefficiency by measuring lost consumer and producer surplus resulting from the intervention.
Comparison Table
| Aspect | Deadweight Loss | Harberger Triangle |
|---|---|---|
| Definition | The overall loss of economic efficiency when equilibrium for a good or service is not achieved or is unachievable. | A graphical representation of deadweight loss shaped like a triangle on supply and demand curves, illustrating the inefficiency caused by a distortion. |
| Context | Occurs due to taxes, subsidies, price ceilings/floors, monopolies, or externalities causing market distortions. | Specifically used to illustrate welfare loss from taxation or other policies causing quantity distortions in markets. |
| Conceptual Focus | Measures lost consumer and producer surplus that is not transferred to any party. | Quantifies the size of deadweight loss area visually and mathematically as a triangle on supply-demand graphs. |
| Representation | Abstract concept summarizing inefficiency | Concrete geometric area between supply and demand curves representing deadweight loss |
| Importance in Economics | Helps evaluate the cost of market interventions and inefficiencies | Provides a tool for calculating and visualizing the magnitude of inefficiency |
| Typical Use Case | General analysis of welfare loss from policies or market failures | Estimating welfare loss from tax imposition, particularly in partial equilibrium analysis |
Deadweight Loss
Deadweight loss represents the loss of economic efficiency when the equilibrium outcome is not achievable or not achieved in a market. It occurs due to factors such as taxes, price floors, price ceilings, or monopolistic pricing, which prevent supply and demand from reaching equilibrium. Deadweight loss results in a reduction of total surplus, comprising both consumer surplus and producer surplus, leading to a net welfare loss for society. Quantifying deadweight loss helps policymakers assess the economic impact of interventions and inefficiencies in markets.
Harberger Triangle
The Harberger Triangle represents the deadweight loss resulting from market inefficiencies caused by taxation, subsidies, or monopolistic pricing. Named after economist Arnold Harberger, it quantifies the loss in total surplus where consumer and producer surplus are not fully realized. This triangular area on the supply and demand graph illustrates how distortions prevent optimal allocation of resources, reducing overall economic welfare. Empirical studies often use the Harberger Triangle to evaluate tax policies and their impact on economic efficiency.
Market Efficiency
Market efficiency in economics refers to the degree to which asset prices reflect all available information. In an efficient market, securities are fairly priced, making it impossible for investors to consistently achieve higher returns without taking on additional risk. The Efficient Market Hypothesis (EMH) categorizes efficiency into three forms: weak, semi-strong, and strong, each differing based on the scope of information reflected in prices. Empirical studies, such as those examining stock market returns, provide mixed evidence on the absolute validity of EMH across different markets and time periods.
Consumer and Producer Surplus
Consumer surplus measures the difference between what consumers are willing to pay for a good or service and the actual market price, reflecting the net benefit to buyers. Producer surplus represents the difference between the market price and the minimum price at which producers are willing to sell, indicating producer gains. These surpluses are graphically illustrated in supply and demand curves, with consumer surplus above the market price line and producer surplus below it. Efficient markets maximize the sum of consumer and producer surplus, signaling optimal resource allocation.
Welfare Economics
Welfare economics analyzes the allocation of resources to improve social welfare and economic efficiency. It evaluates policies based on Pareto efficiency and social welfare functions, focusing on equity and optimal distribution. Key concepts include consumer and producer surplus, externalities, and market failures, which highlight situations where free markets do not maximize societal well-being. This field guides government interventions designed to correct inefficiencies and promote fair outcomes in the economy.
Source and External Links
Harberger's triangle - Market - Subwiki - Harberger's triangle is a graphical representation of deadweight loss caused by market distortions such as taxes, market power, or government intervention, shaped as a triangle between the supply and demand curves; it quantifies the loss in economic efficiency when trades that would be beneficial do not occur or occur excessively.
Three Sides of Harberger Triangles - Harberger's triangle provides an approximation of the deadweight loss measured by changes in consumer utility due to taxation or price changes, though its accuracy may vary compared to compensated demand measures, highlighting the methodological nuances in measuring deadweight loss.
Deadweight Loss & Optimal Commodity Taxation 1 - Harberger's formula shows that deadweight loss (the Harberger triangle) increases roughly with the square of the distortion size (e.g., the tax rate), and is strongly influenced by the price elasticities of supply and demand, illustrating why this triangle is a key tool in analyzing efficiency losses.
FAQs
What is deadweight loss in economics?
Deadweight loss in economics is the loss of economic efficiency when the equilibrium outcome is not achieved, often due to taxes, subsidies, price ceilings, or monopolies, leading to reduced total surplus in the market.
What is the Harberger triangle?
The Harberger triangle is an economic concept representing the efficiency loss or deadweight loss resulting from taxation or property rights distribution inefficiencies in Harberger's model of self-assessed property tax.
How does deadweight loss occur in markets?
Deadweight loss occurs in markets when inefficient allocation of resources arises due to price controls, taxes, subsidies, or monopolies, causing a reduction in total surplus by preventing mutually beneficial trades.
How are deadweight loss and the Harberger triangle related?
The Harberger triangle represents the deadweight loss in a market caused by inefficiencies such as taxes, subsidies, or price controls.
What causes the Harberger triangle to appear?
The Harberger triangle appears due to inefficiencies in property taxation when owners undervalue their assets to minimize tax payments while risking forced sales at the declared prices.
How is deadweight loss measured using the Harberger triangle?
Deadweight loss is measured using the Harberger triangle by calculating the area of the triangle formed between the supply and demand curves at the quantities before and after a market distortion, representing the lost consumer and producer surplus.
Why is understanding deadweight loss important for policymakers?
Understanding deadweight loss is important for policymakers because it helps them identify inefficiencies in resource allocation, assess the economic impact of taxes and regulations, and design policies that minimize welfare losses while maximizing social welfare.