The Edgeworth Box illustrates the distribution of resources between two agents in a two-good economy, focusing on efficient allocations and mutual gains from trade. The Production Possibility Frontier (PPF) graphically represents the maximum output combinations of two goods an economy can achieve given fixed resources and technology. Explore the distinctions and applications of these economic models to deepen your understanding of resource allocation and production efficiency.
Main Difference
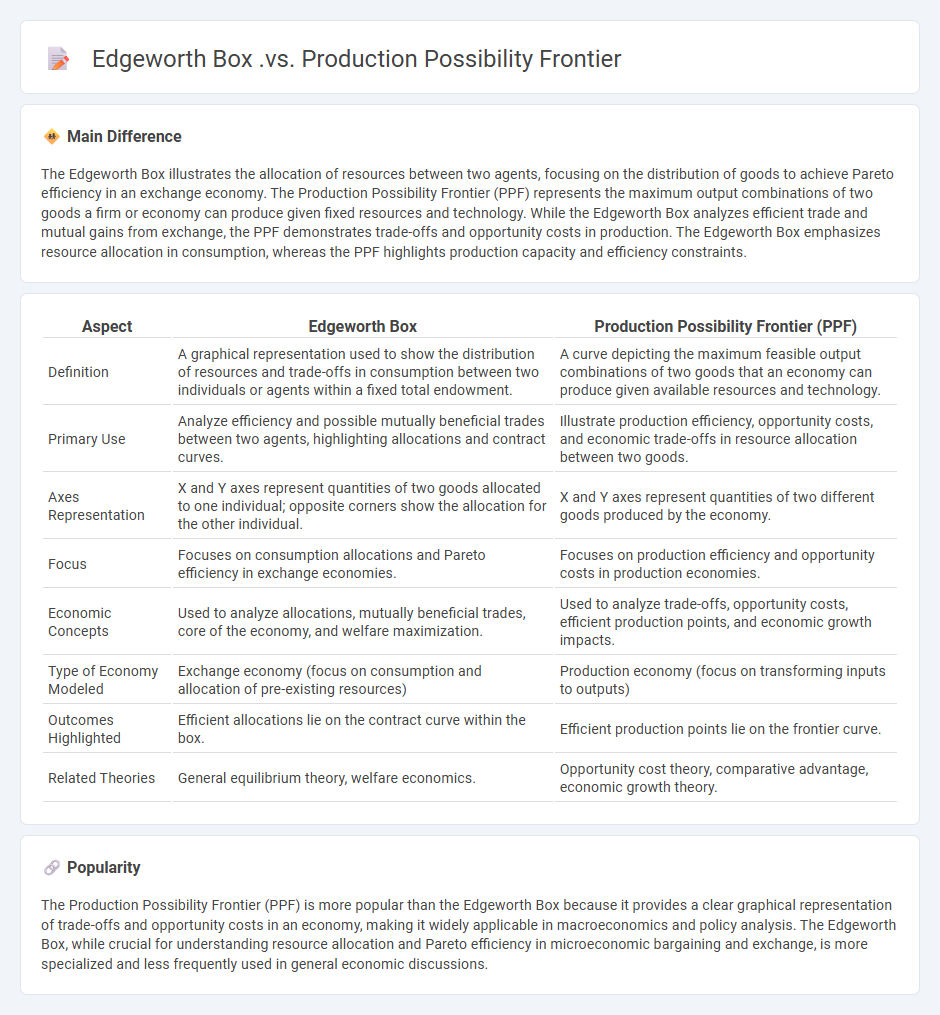
The Edgeworth Box illustrates the allocation of resources between two agents, focusing on the distribution of goods to achieve Pareto efficiency in an exchange economy. The Production Possibility Frontier (PPF) represents the maximum output combinations of two goods a firm or economy can produce given fixed resources and technology. While the Edgeworth Box analyzes efficient trade and mutual gains from exchange, the PPF demonstrates trade-offs and opportunity costs in production. The Edgeworth Box emphasizes resource allocation in consumption, whereas the PPF highlights production capacity and efficiency constraints.
Connection
The Edgeworth Box illustrates the efficient allocation of resources between two agents, reflecting potential trades and mutual gains. The Production Possibility Frontier (PPF) represents the maximum output combinations of two goods that an economy can produce given fixed resources and technology. Both tools highlight efficiency and trade-offs in resource allocation, with the Edgeworth Box focusing on distribution and the PPF emphasizing production capacity constraints.
Comparison Table
| Aspect | Edgeworth Box | Production Possibility Frontier (PPF) |
|---|---|---|
| Definition | A graphical representation used to show the distribution of resources and trade-offs in consumption between two individuals or agents within a fixed total endowment. | A curve depicting the maximum feasible output combinations of two goods that an economy can produce given available resources and technology. |
| Primary Use | Analyze efficiency and possible mutually beneficial trades between two agents, highlighting allocations and contract curves. | Illustrate production efficiency, opportunity costs, and economic trade-offs in resource allocation between two goods. |
| Axes Representation | X and Y axes represent quantities of two goods allocated to one individual; opposite corners show the allocation for the other individual. | X and Y axes represent quantities of two different goods produced by the economy. |
| Focus | Focuses on consumption allocations and Pareto efficiency in exchange economies. | Focuses on production efficiency and opportunity costs in production economies. |
| Economic Concepts | Used to analyze allocations, mutually beneficial trades, core of the economy, and welfare maximization. | Used to analyze trade-offs, opportunity costs, efficient production points, and economic growth impacts. |
| Type of Economy Modeled | Exchange economy (focus on consumption and allocation of pre-existing resources) | Production economy (focus on transforming inputs to outputs) |
| Outcomes Highlighted | Efficient allocations lie on the contract curve within the box. | Efficient production points lie on the frontier curve. |
| Related Theories | General equilibrium theory, welfare economics. | Opportunity cost theory, comparative advantage, economic growth theory. |
Resource Allocation
Resource allocation in economics involves the efficient distribution of limited resources among competing uses to maximize productivity and economic welfare. It addresses the fundamental economic problem of scarcity by determining how factors of production--land, labor, capital, and entrepreneurship--are utilized in various sectors. Market mechanisms such as supply and demand, price signals, and government interventions like taxation and subsidies influence allocation decisions. Optimal resource allocation enhances economic growth, improves living standards, and reduces inefficiencies in both microeconomic and macroeconomic contexts.
Pareto Efficiency
Pareto Efficiency in economics refers to an allocation of resources where no individual can be made better off without making someone else worse off. This concept is fundamental in welfare economics and is often used to evaluate the efficiency of market outcomes and policy decisions. Achieving Pareto Efficiency implies optimal distribution but does not necessarily guarantee equity or fairness. It forms the basis for analyzing trade-offs in resource allocation and economic optimization models.
Consumption vs. Production
Consumption drives demand by utilizing goods and services to fulfill human needs and desires, directly impacting economic growth and resource allocation. Production involves creating goods and services through labor, capital, and technology, forming the backbone of a nation's GDP. The balance between consumption and production determines trade dynamics, investment strategies, and overall economic stability. Efficient resource distribution between these two factors influences inflation rates, employment levels, and long-term sustainability.
Opportunity Cost
Opportunity cost in economics refers to the value of the next best alternative foregone when a decision is made. It quantifies the trade-offs involved in resource allocation, emphasizing that every choice has a cost measured by what is sacrificed. Businesses and individuals use opportunity cost to evaluate the benefits of various options, ensuring efficient utilization of scarce resources. Understanding opportunity cost is critical for optimizing decisions in investment, production, and consumption.
Market Equilibrium
Market equilibrium occurs when the quantity of goods supplied equals the quantity demanded at a specific price level, resulting in a stable market condition. This balance prevents excess supply or shortages, facilitating efficient resource allocation within an economy. The equilibrium price, also known as the market-clearing price, adjusts based on shifts in demand or supply curves influenced by factors such as consumer preferences, production costs, and external shocks. Understanding market equilibrium is essential for analyzing price mechanisms and predicting market responses to economic policies.
Source and External Links
Derivation of Production Possibility Frontier - Concept - The Edgeworth Box illustrates how labor and capital can be allocated between two firms to produce two goods, with the contract curve showing efficient allocations; mapping these efficiencies forms the Production Possibility Frontier (PPF), which shows the maximum output combinations and reflects opportunity costs due to resource specialization.
Production-possibility frontier - The PPF can be derived from the contract curve in the Edgeworth Box and typically appears concave due to increasing opportunity costs stemming from differences in factor intensity and specialization across production sectors.
AE 503: PRODUCTION AND EDGEWORTH BOX - The Edgeworth Box framework analyzes efficiency in production and exchange, where points on the contract curve within the box correspond to efficient allocations, and the PPF represents these efficient production possibilities, with prices and marginal rates equating at tangency points.
FAQs
What is an Edgeworth Box?
An Edgeworth Box is a graphical representation used in microeconomics to illustrate the distribution of resources and the potential gains from trade between two consumers.
What is a Production Possibility Frontier?
A Production Possibility Frontier (PPF) is a curve depicting the maximum output combinations of two goods or services achievable with available resources and technology.
How does the Edgeworth Box illustrate resource allocation?
The Edgeworth Box illustrates resource allocation by graphically representing the distribution of two goods between two agents, showing all feasible allocations and helping identify points of Pareto efficiency where no agent can be made better off without making the other worse off.
How does the Production Possibility Frontier represent trade-offs?
The Production Possibility Frontier (PPF) represents trade-offs by illustrating the maximum attainable combinations of two goods, showing that producing more of one good requires sacrificing some quantity of the other due to limited resources.
What are the key differences between the Edgeworth Box and the Production Possibility Frontier?
The Edgeworth Box illustrates allocations and trade-offs between two consumers' utility in a two-good, two-person exchange economy, emphasizing contract curves and Pareto efficiency, while the Production Possibility Frontier (PPF) depicts maximum output combinations of two goods achievable with fixed resources and technology, highlighting opportunity costs and productive efficiency.
When should you use an Edgeworth Box instead of a Production Possibility Frontier?
Use an Edgeworth Box to analyze resource allocation and trade-offs between two agents or consumers in a two-good exchange economy; use a Production Possibility Frontier (PPF) to illustrate the maximum output combinations of two goods producible with given resources and technology in an economy.
What insights do both tools provide about economic efficiency?
Both tools reveal economic efficiency by analyzing resource allocation, productivity metrics, cost minimization, and output maximization within given constraints.