Monte Carlo Simulation generates thousands of random portfolio value scenarios to estimate risk exposure, capturing complex dependencies and nonlinearities in asset returns. Value at Risk (VaR) provides a specific quantile-based loss threshold over a defined time horizon and confidence level, quantifying the maximum expected loss under normal market conditions. Explore the strengths and applications of these risk management techniques in financial analysis.
Main Difference
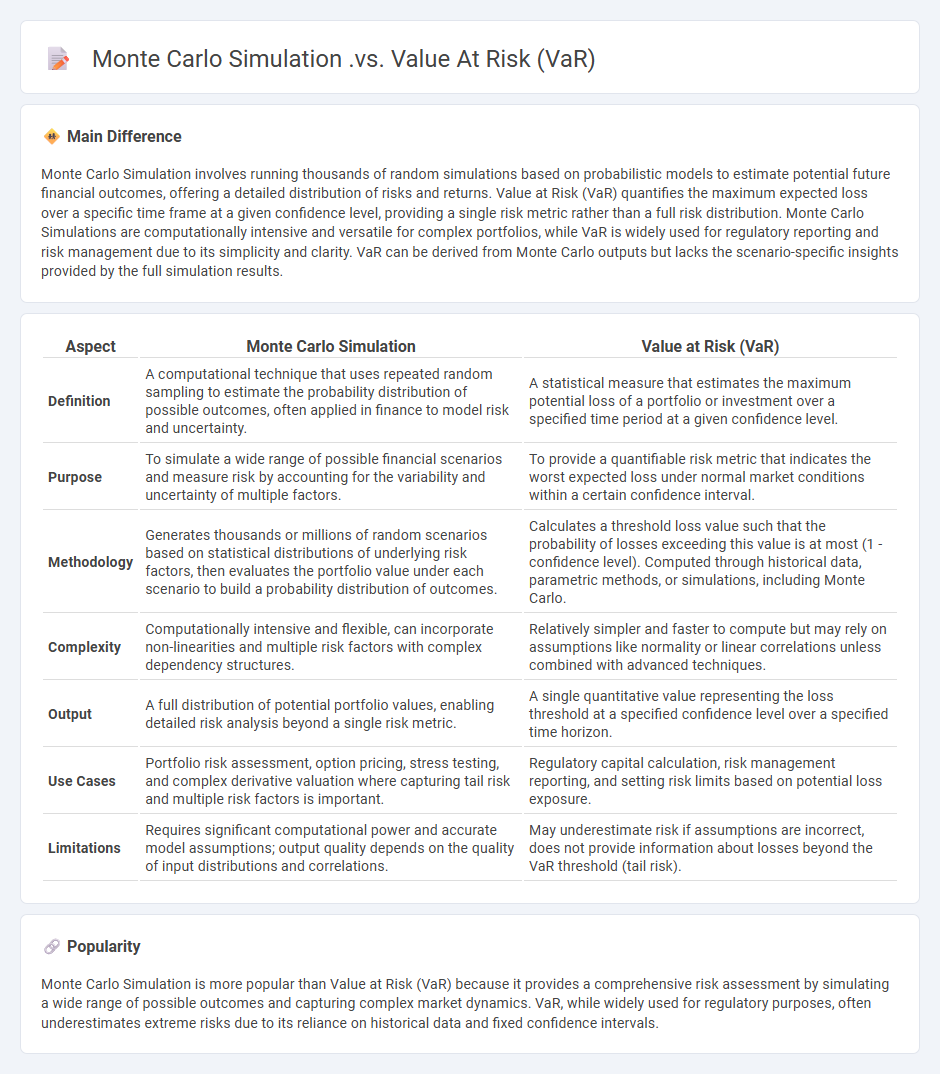
Monte Carlo Simulation involves running thousands of random simulations based on probabilistic models to estimate potential future financial outcomes, offering a detailed distribution of risks and returns. Value at Risk (VaR) quantifies the maximum expected loss over a specific time frame at a given confidence level, providing a single risk metric rather than a full risk distribution. Monte Carlo Simulations are computationally intensive and versatile for complex portfolios, while VaR is widely used for regulatory reporting and risk management due to its simplicity and clarity. VaR can be derived from Monte Carlo outputs but lacks the scenario-specific insights provided by the full simulation results.
Connection
Monte Carlo Simulation enhances Value at Risk (VaR) by generating numerous possible portfolio value outcomes through random sampling of risk factors, providing a detailed distribution of potential losses. This technique captures non-linear risks and complex asset correlations that traditional VaR methods might miss, improving accuracy in risk estimation. Financial institutions utilize Monte Carlo-based VaR models to quantify potential losses under various market conditions and stress scenarios.
Comparison Table
| Aspect | Monte Carlo Simulation | Value at Risk (VaR) |
|---|---|---|
| Definition | A computational technique that uses repeated random sampling to estimate the probability distribution of possible outcomes, often applied in finance to model risk and uncertainty. | A statistical measure that estimates the maximum potential loss of a portfolio or investment over a specified time period at a given confidence level. |
| Purpose | To simulate a wide range of possible financial scenarios and measure risk by accounting for the variability and uncertainty of multiple factors. | To provide a quantifiable risk metric that indicates the worst expected loss under normal market conditions within a certain confidence interval. |
| Methodology | Generates thousands or millions of random scenarios based on statistical distributions of underlying risk factors, then evaluates the portfolio value under each scenario to build a probability distribution of outcomes. | Calculates a threshold loss value such that the probability of losses exceeding this value is at most (1 - confidence level). Computed through historical data, parametric methods, or simulations, including Monte Carlo. |
| Complexity | Computationally intensive and flexible, can incorporate non-linearities and multiple risk factors with complex dependency structures. | Relatively simpler and faster to compute but may rely on assumptions like normality or linear correlations unless combined with advanced techniques. |
| Output | A full distribution of potential portfolio values, enabling detailed risk analysis beyond a single risk metric. | A single quantitative value representing the loss threshold at a specified confidence level over a specified time horizon. |
| Use Cases | Portfolio risk assessment, option pricing, stress testing, and complex derivative valuation where capturing tail risk and multiple risk factors is important. | Regulatory capital calculation, risk management reporting, and setting risk limits based on potential loss exposure. |
| Limitations | Requires significant computational power and accurate model assumptions; output quality depends on the quality of input distributions and correlations. | May underestimate risk if assumptions are incorrect, does not provide information about losses beyond the VaR threshold (tail risk). |
Probabilistic Modeling
Probabilistic modeling in finance involves the use of statistical methods and probability theory to analyze and predict financial markets and asset behaviors. Techniques such as Monte Carlo simulations, Bayesian inference, and stochastic processes help quantify risk, forecast price movements, and optimize portfolio allocation. Key applications include credit risk assessment, option pricing using models like Black-Scholes, and Value at Risk (VaR) calculations. Financial institutions leverage these models to improve decision-making under uncertainty and enhance risk management strategies.
Risk Quantification
Risk quantification in finance involves measuring and modeling potential losses to assess the likelihood and impact of adverse events on investment portfolios and financial institutions. Techniques such as Value at Risk (VaR), Conditional Value at Risk (CVaR), and stress testing provide quantitative metrics for predicting financial risk exposures. Advanced models incorporate historical data, volatility measures, and correlation matrices to optimize risk-adjusted returns. Regulatory frameworks like Basel III emphasize rigorous risk quantification for capital adequacy and systemic stability.
Tail Risk
Tail risk refers to the probability of extreme loss events in financial markets that lie in the far ends (tails) of a probability distribution. These rare events, such as market crashes or sudden economic shocks, can lead to significant portfolio value declines beyond what is predicted by normal distribution models. Financial institutions employ various risk management strategies, including stress testing and Value at Risk (VaR) models, to quantify and mitigate tail risk exposure. Understanding tail risk is crucial for investment decisions, especially in derivatives, hedge funds, and risk-sensitive asset allocation.
Scenario Analysis
Scenario analysis in finance involves evaluating the impact of different hypothetical events on investment portfolios or financial plans. It helps identify potential risks and assess portfolio resilience under various market conditions, such as economic recessions or interest rate fluctuations. Financial institutions use scenario analysis to ensure regulatory compliance and inform strategic decision-making. This method supports stress testing by simulating outcomes based on historical and projected data to enhance risk management.
Confidence Level
Confidence level in finance quantifies the probability that a statistical estimate, such as Value at Risk (VaR) or portfolio return, lies within a specified interval. Commonly used confidence levels in financial risk management include 90%, 95%, and 99%, with higher levels indicating greater certainty. Regulatory frameworks like Basel III often mandate a 99% confidence level for calculating market risk capital requirements. Accurate confidence levels help investors and institutions manage risk exposure and make informed decisions under uncertainty.
Source and External Links
COMPARISON OF VALUE AT RISK USING HISTORICAL AND ... - Monte Carlo simulation is one of the methods to calculate Value at Risk (VaR), using simulated return data without assuming linear portfolio return relationships, offering more accuracy but at a higher computational cost compared to variance-covariance and historical methods.
The Monte Carlo simulation method for VaR calculation - Monte Carlo simulation provides a flexible and powerful approach to VaR by modeling a wide range of scenarios including nonlinear exposures, but it is computationally intensive and requires considerable system development and computing power.
Comparing Historical Simulation and Monte Carlo Simulation in ... - Unlike other VaR methods, Monte Carlo simulation does not assume normality of returns and can model complex portfolios and nonlinear instruments, but it involves model risk and requires specialized knowledge for proper implementation.
FAQs
What is Monte Carlo simulation?
Monte Carlo simulation is a computational technique that uses random sampling and statistical modeling to estimate numerical results and assess the impact of uncertainty in complex systems and processes.
What is Value at Risk?
Value at Risk (VaR) quantifies the maximum potential financial loss of a portfolio over a specified time period at a given confidence level.
How does Monte Carlo simulation work in risk analysis?
Monte Carlo simulation in risk analysis works by generating thousands of random variable scenarios based on probability distributions to model uncertainty, quantify potential outcomes, and calculate the probability of different risks impacting a project or investment.
How is Value at Risk calculated?
Value at Risk (VaR) is calculated by estimating the maximum potential loss of a portfolio over a specified time horizon at a given confidence level using historical simulation, variance-covariance method, or Monte Carlo simulation.
What are the key differences between Monte Carlo simulation and Value at Risk?
Monte Carlo simulation generates numerous random scenarios to model potential portfolio outcomes, capturing a wide range of risks and their distributions, while Value at Risk (VaR) provides a single quantile-based metric indicating the maximum expected loss over a given time horizon at a specified confidence level.
When should you use Monte Carlo simulation instead of Value at Risk?
Use Monte Carlo simulation instead of Value at Risk when modeling complex portfolios with non-linear risks, path-dependent options, or requiring detailed scenario analysis beyond the normal distribution assumptions of VaR.
What are the limitations of Monte Carlo simulation and Value at Risk?
Monte Carlo simulation is limited by high computational costs, model input uncertainty, and reliance on assumptions about probability distributions; Value at Risk (VaR) is limited by its inability to predict losses beyond the specified confidence level, sensitivity to historical data, and failure to capture extreme tail risks.