Implied volatility represents the market's forecast of a security's future price fluctuations derived from option prices, while historical volatility measures past price movements based on historical data. Comparing implied volatility and historical volatility helps investors assess market sentiment and identify potential trading opportunities. Explore the key differences and practical applications of these volatility metrics to enhance your investment strategy.
Main Difference
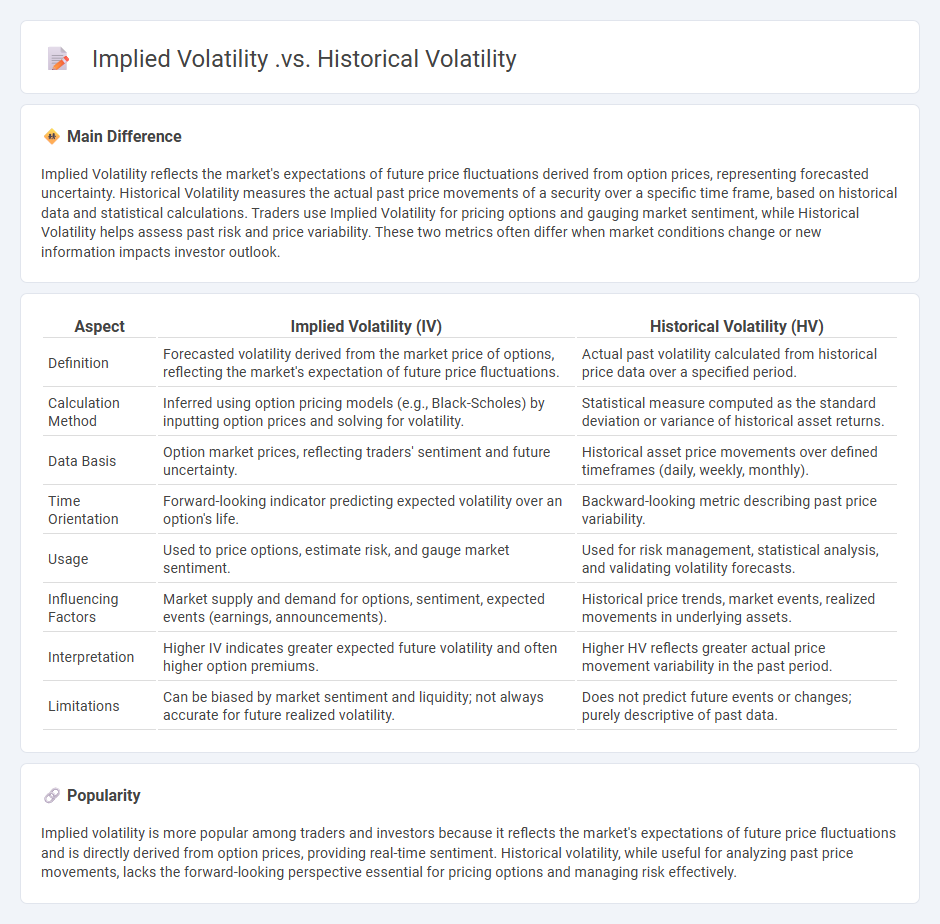
Implied Volatility reflects the market's expectations of future price fluctuations derived from option prices, representing forecasted uncertainty. Historical Volatility measures the actual past price movements of a security over a specific time frame, based on historical data and statistical calculations. Traders use Implied Volatility for pricing options and gauging market sentiment, while Historical Volatility helps assess past risk and price variability. These two metrics often differ when market conditions change or new information impacts investor outlook.
Connection
Implied volatility reflects the market's forecast of a security's future price fluctuations derived from option prices, while historical volatility measures past price movements based on historical data. Both metrics assess volatility but differ in timeframe and source; implied volatility incorporates market expectations, whereas historical volatility relies solely on actual past returns. Comparing these volatilities helps traders identify potential discrepancies and market sentiment shifts.
Comparison Table
| Aspect | Implied Volatility (IV) | Historical Volatility (HV) |
|---|---|---|
| Definition | Forecasted volatility derived from the market price of options, reflecting the market's expectation of future price fluctuations. | Actual past volatility calculated from historical price data over a specified period. |
| Calculation Method | Inferred using option pricing models (e.g., Black-Scholes) by inputting option prices and solving for volatility. | Statistical measure computed as the standard deviation or variance of historical asset returns. |
| Data Basis | Option market prices, reflecting traders' sentiment and future uncertainty. | Historical asset price movements over defined timeframes (daily, weekly, monthly). |
| Time Orientation | Forward-looking indicator predicting expected volatility over an option's life. | Backward-looking metric describing past price variability. |
| Usage | Used to price options, estimate risk, and gauge market sentiment. | Used for risk management, statistical analysis, and validating volatility forecasts. |
| Influencing Factors | Market supply and demand for options, sentiment, expected events (earnings, announcements). | Historical price trends, market events, realized movements in underlying assets. |
| Interpretation | Higher IV indicates greater expected future volatility and often higher option premiums. | Higher HV reflects greater actual price movement variability in the past period. |
| Limitations | Can be biased by market sentiment and liquidity; not always accurate for future realized volatility. | Does not predict future events or changes; purely descriptive of past data. |
Implied Volatility (IV)
Implied Volatility (IV) represents the market's forecast of a security's potential price fluctuations, derived from option prices using the Black-Scholes model or other pricing frameworks. High IV indicates expectations of significant price movement, often linked to upcoming earnings reports or economic events, while low IV suggests a stable market outlook. Traders use IV to gauge market sentiment, price options, and manage risk, making it a critical component in options trading strategies. IV does not predict the direction of price change but reflects the magnitude of expected volatility.
Historical Volatility (HV)
Historical Volatility (HV) measures the dispersion of past returns for a financial asset over a specific period, using statistical calculations such as standard deviation. This metric helps investors assess the risk and price fluctuations of stocks, bonds, or other securities by analyzing past market prices, often over 20 to 30 trading days. HV is crucial in option pricing models like Black-Scholes, influencing implied volatility and deriving fair value. Real-time HV data is available through financial platforms like Bloomberg or Reuters, aiding in strategic portfolio management and risk assessment.
Options Pricing
Options pricing involves determining the fair value of derivatives based on underlying asset volatility, time to expiration, and strike price using models like Black-Scholes and Binomial trees. Implied volatility derived from market prices influences premium calculations and risk assessments. Accurate options pricing enables traders to hedge portfolios and design complex strategies such as spreads and straddles. Real-time market data and historical price analysis are essential for dynamic adjustments in pricing models.
Volatility Forecasting
Volatility forecasting plays a crucial role in finance by predicting the degree of variation in asset prices over time, essential for risk management and derivative pricing. Models such as GARCH (Generalized Autoregressive Conditional Heteroskedasticity) and stochastic volatility models are widely used to capture time-varying volatility patterns in financial markets. Accurate volatility forecasts improve portfolio optimization and hedging strategies, reducing the potential for significant losses. Empirical studies show that high-frequency data enhances forecasting accuracy, making intraday volatility modeling increasingly important.
Market Sentiment
Market sentiment reflects the overall attitude of investors toward a particular financial market or asset, often driven by emotions like fear and greed. It influences price movements and trends by affecting buying and selling behaviors, which can be measured through indicators such as the VIX volatility index or investor surveys. Positive market sentiment typically leads to bullish trends, while negative sentiment often triggers bearish markets and increased volatility. Traders and analysts use sentiment analysis to anticipate market shifts and adjust their strategies accordingly.
Source and External Links
Implied Volatility vs Historical Volatility | Blog - Option Samurai - Implied volatility (IV) reflects market expectations of future volatility based on option prices, while historical volatility (HV) measures past price fluctuations; IV tends to lead HV and predicts short-term future volatility, particularly important in options trading risk assessment and pricing.
Aligning Your Options with Implied Volatility - Charles Schwab - Historical volatility measures past stock price movements, whereas implied volatility expresses market expectations for future volatility; comparing the two helps determine if options are potentially expensive or inexpensive relative to past behavior.
Implied Volatility vs Historical Volatility Compared - SoFi - Historical volatility looks at actual past price changes, while implied volatility gauges expected future price fluctuations derived from option prices; traders use both together, for example, in volatility skew and smile strategies to better inform trading decisions.
FAQs
What is implied volatility?
Implied volatility is the market's forecast of a stock's future price fluctuations, derived from the price of options contracts.
What is historical volatility?
Historical volatility measures the statistical dispersion of past asset returns, calculated as the standard deviation of historical price changes over a specific period.
How is implied volatility calculated?
Implied volatility is calculated by inputting the market price of an option into an option pricing model, such as the Black-Scholes model, and iteratively solving for the volatility value that equates the model price to the observed market price.
How is historical volatility measured?
Historical volatility is measured by calculating the standard deviation of an asset's logarithmic returns over a specific time period.
What does implied volatility indicate about future market expectations?
Implied volatility reflects the market's forecast of the underlying asset's potential price fluctuations, indicating higher expected uncertainty or risk.
How does historical volatility reflect past price movement?
Historical volatility measures the standard deviation of past asset price returns over a specific period, quantifying the degree of price fluctuations and indicating the asset's past market risk.
Why do traders compare implied volatility with historical volatility?
Traders compare implied volatility with historical volatility to identify potential mispricings in options and gauge market expectations versus past price movements.