The Sharpe Ratio measures risk-adjusted return by comparing portfolio excess return to its total volatility, while the Information Ratio evaluates active management by comparing excess return to tracking error against a benchmark. Both metrics are essential for investors to gauge performance efficiency but differ in focus on total risk versus active risk. Explore the nuances of these ratios to enhance your investment analysis strategy.
Main Difference
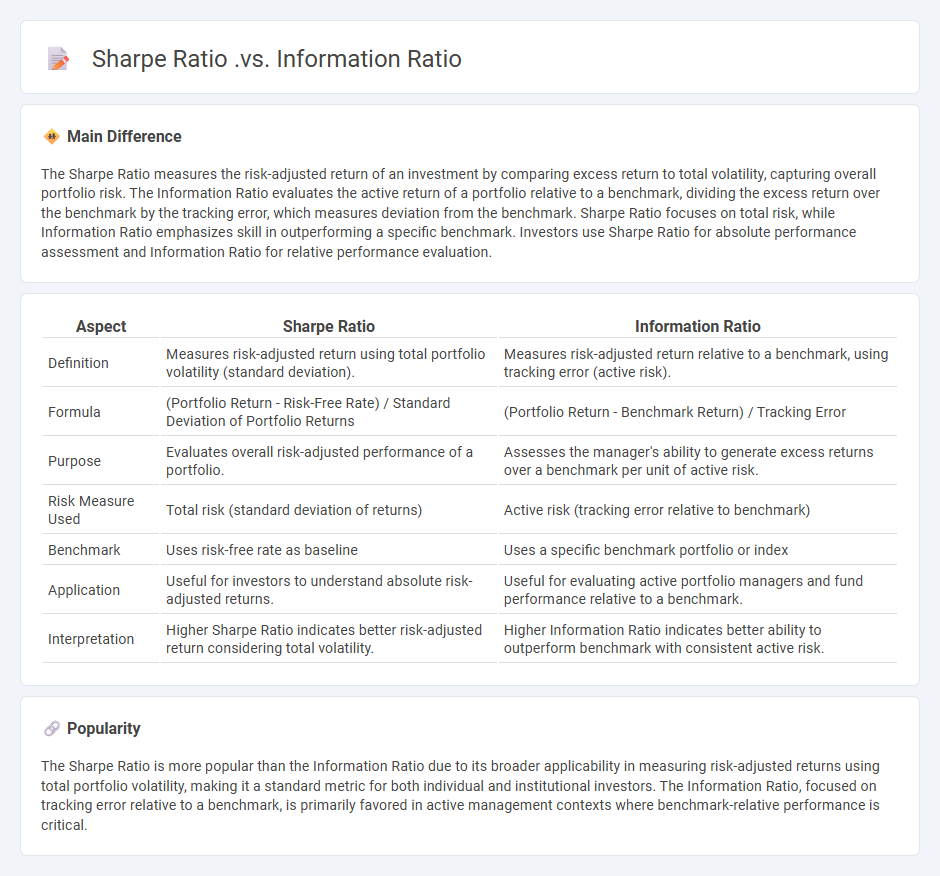
The Sharpe Ratio measures the risk-adjusted return of an investment by comparing excess return to total volatility, capturing overall portfolio risk. The Information Ratio evaluates the active return of a portfolio relative to a benchmark, dividing the excess return over the benchmark by the tracking error, which measures deviation from the benchmark. Sharpe Ratio focuses on total risk, while Information Ratio emphasizes skill in outperforming a specific benchmark. Investors use Sharpe Ratio for absolute performance assessment and Information Ratio for relative performance evaluation.
Connection
The Sharpe Ratio measures the risk-adjusted return of an investment by comparing its excess return to total volatility, while the Information Ratio evaluates the excess return relative to a benchmark by dividing active return by tracking error. Both ratios assess performance efficiency but differ in focus: the Sharpe Ratio uses total risk as a denominator, and the Information Ratio uses active risk against a benchmark. Investors use these ratios together to balance absolute risk-adjusted returns with relative performance consistency.
Comparison Table
| Aspect | Sharpe Ratio | Information Ratio |
|---|---|---|
| Definition | Measures risk-adjusted return using total portfolio volatility (standard deviation). | Measures risk-adjusted return relative to a benchmark, using tracking error (active risk). |
| Formula | (Portfolio Return - Risk-Free Rate) / Standard Deviation of Portfolio Returns | (Portfolio Return - Benchmark Return) / Tracking Error |
| Purpose | Evaluates overall risk-adjusted performance of a portfolio. | Assesses the manager's ability to generate excess returns over a benchmark per unit of active risk. |
| Risk Measure Used | Total risk (standard deviation of returns) | Active risk (tracking error relative to benchmark) |
| Benchmark | Uses risk-free rate as baseline | Uses a specific benchmark portfolio or index |
| Application | Useful for investors to understand absolute risk-adjusted returns. | Useful for evaluating active portfolio managers and fund performance relative to a benchmark. |
| Interpretation | Higher Sharpe Ratio indicates better risk-adjusted return considering total volatility. | Higher Information Ratio indicates better ability to outperform benchmark with consistent active risk. |
**Sharpe Ratio**
The Sharpe Ratio measures the risk-adjusted return of an investment by dividing the excess return over the risk-free rate by the investment's standard deviation. It is widely used to evaluate the performance of portfolios, mutual funds, and hedge funds by comparing returns relative to their volatility. A higher Sharpe Ratio indicates better risk-adjusted performance, with values above 1 considered desirable in the finance industry. The metric was introduced by Nobel laureate William F. Sharpe in 1966 and remains a cornerstone in portfolio management and asset allocation decisions.
**Information Ratio**
The Information Ratio measures the risk-adjusted return of an investment portfolio relative to a benchmark by dividing the portfolio's active return by the tracking error. It quantifies how much excess return an investment generates per unit of active risk, with higher ratios indicating more efficient risk-taking. Typical Information Ratios above 0.5 are considered good, while values exceeding 1.0 signify exceptional performance. This metric is widely used by portfolio managers to assess skill in outperforming the market consistently.
**Risk-Adjusted Return**
Risk-adjusted return measures investment performance by accounting for the level of risk taken to achieve a given return, enabling more accurate comparison across different assets. Common metrics include the Sharpe ratio, which divides excess return by standard deviation, and the Treynor ratio, which uses beta to assess systematic risk. These measures help investors evaluate whether higher returns justify additional risk exposure in portfolios containing stocks, bonds, or alternative investments. Financial analysts rely on risk-adjusted returns to optimize asset allocation, improve portfolio efficiency, and make informed decisions under uncertainty.
**Benchmark Comparison**
Benchmark comparison in finance involves evaluating the performance of an investment portfolio against a standard index such as the S&P 500 or the MSCI World Index. This process helps investors and fund managers assess risk-adjusted returns, identify alpha generation, and make informed asset allocation decisions. Key metrics used include tracking error, beta, and the Sharpe ratio, which quantify volatility and return relative to the benchmark. Consistent outperformance of a benchmark indicates skillful management and effective investment strategies.
**Active Management Evaluation**
Active management evaluation in finance involves assessing the performance of portfolio managers against relevant benchmarks to determine their value-added returns. Metrics such as alpha, Sharpe ratio, and information ratio quantify risk-adjusted returns and consistency in outperforming passive indices. Studies show that a majority of actively managed funds underperform their benchmarks after fees, emphasizing the importance of cost analysis. This evaluation aids investors in making informed decisions between active and passive investment strategies.
Source and External Links
The Sharpe Ratio and the Information Ratio - This document compares the Sharpe ratio, used for evaluating individual portfolios, with the information ratio, used for assessing multi-asset portfolios or manager performance.
How's That Fund Doing? Check the Information Ratio - This article discusses how the Sharpe ratio compares a fund's returns to a cash rate, while the information ratio compares returns to a benchmark index, highlighting their use in evaluating fund performance.
Information Ratio - The information ratio measures a portfolio's active return against a benchmark, relative to its tracking error, differing from the Sharpe ratio which uses a risk-free rate.
FAQs
What do the Sharpe Ratio and Information Ratio measure?
The Sharpe Ratio measures risk-adjusted return by comparing portfolio excess return to its total volatility, while the Information Ratio measures active return relative to benchmark tracking error, assessing consistency of outperformance.
How is the Sharpe Ratio calculated?
The Sharpe Ratio is calculated by subtracting the risk-free rate from the portfolio's return, then dividing the result by the portfolio's standard deviation of returns.
How is the Information Ratio calculated?
The Information Ratio is calculated by dividing the active return of an investment portfolio over a benchmark by the tracking error, specifically: Information Ratio = (Portfolio Return - Benchmark Return) / Tracking Error.
What are the key differences between Sharpe Ratio and Information Ratio?
The Sharpe Ratio measures risk-adjusted return by comparing portfolio excess return over the risk-free rate to total volatility, while the Information Ratio evaluates active return relative to a benchmark divided by the tracking error, focusing on manager skill in generating alpha.
When should you use the Sharpe Ratio instead of the Information Ratio?
Use the Sharpe Ratio to evaluate the risk-adjusted return of a portfolio relative to a risk-free rate, focusing on total volatility, and use the Information Ratio to assess the active return of a portfolio compared to a benchmark, emphasizing tracking error.
What are the limitations of the Sharpe Ratio and Information Ratio?
The Sharpe Ratio is limited by its assumption of normally distributed returns, sensitivity to volatility as a risk measure, inability to differentiate between upside and downside volatility, and distortion during periods of negative or low volatility. The Information Ratio is constrained by its reliance on accurately estimated benchmark returns, sensitivity to benchmark selection, potential to be misinterpreted in volatile markets, and dependence on consistent active management performance relative to the benchmark.
How do investors interpret values of Sharpe and Information Ratios?
Investors interpret a higher Sharpe Ratio as indicating better risk-adjusted returns, reflecting excess return per unit of total risk, while a higher Information Ratio signifies superior active management skill by measuring excess return relative to benchmark tracking error.