Value-at-Risk (VaR) quantifies the maximum potential loss within a given confidence level over a specific time horizon, serving as a key risk metric in finance. Conditional Value-at-Risk (CVaR), also known as Expected Shortfall, provides the average loss exceeding the VaR threshold, offering a more comprehensive view of tail risk. Explore the detailed differences and applications of VaR and CVaR to enhance your risk management strategy.
Main Difference
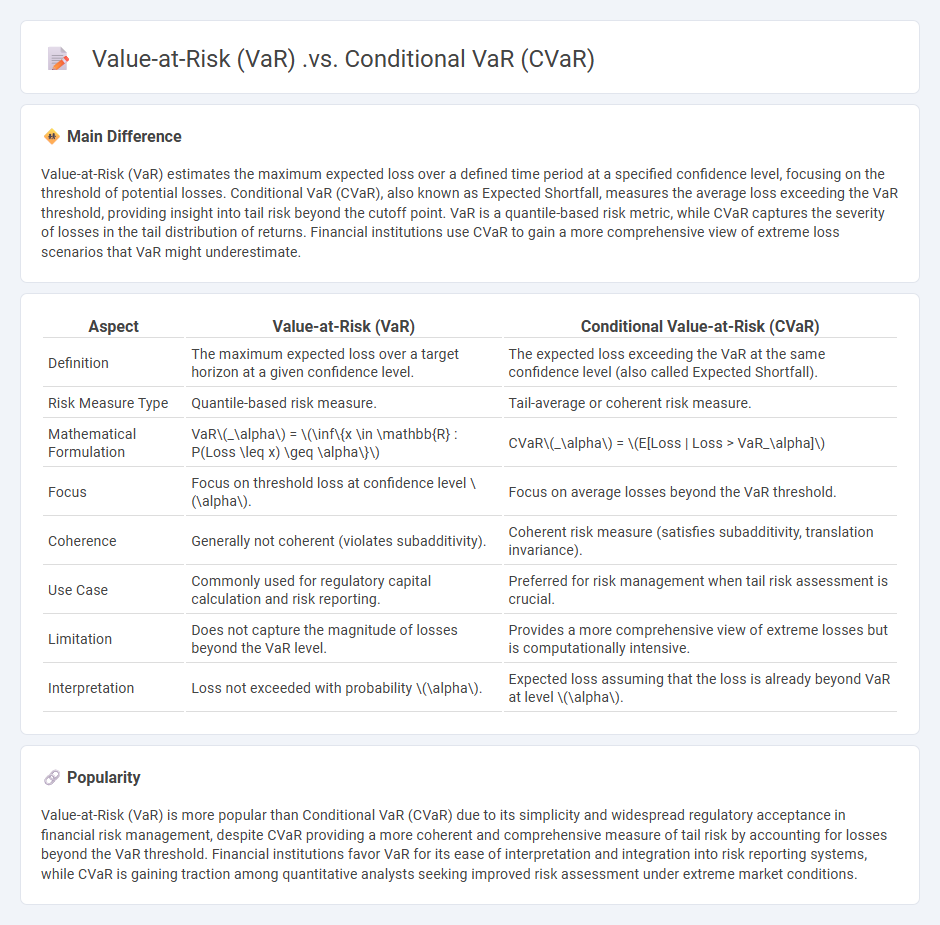
Value-at-Risk (VaR) estimates the maximum expected loss over a defined time period at a specified confidence level, focusing on the threshold of potential losses. Conditional VaR (CVaR), also known as Expected Shortfall, measures the average loss exceeding the VaR threshold, providing insight into tail risk beyond the cutoff point. VaR is a quantile-based risk metric, while CVaR captures the severity of losses in the tail distribution of returns. Financial institutions use CVaR to gain a more comprehensive view of extreme loss scenarios that VaR might underestimate.
Connection
Value-at-Risk (VaR) quantifies the maximum expected loss over a defined time horizon at a given confidence level, while Conditional Value-at-Risk (CVaR) measures the expected loss exceeding the VaR threshold, providing insight into tail risk. CVaR, also known as Expected Shortfall, offers a coherent risk measure by capturing extreme losses beyond the VaR cutoff, making it more sensitive to tail distributions. This connection enables risk managers to not only understand the threshold loss via VaR but also assess the magnitude of potential losses in worst-case scenarios through CVaR.
Comparison Table
| Aspect | Value-at-Risk (VaR) | Conditional Value-at-Risk (CVaR) |
|---|---|---|
| Definition | The maximum expected loss over a target horizon at a given confidence level. | The expected loss exceeding the VaR at the same confidence level (also called Expected Shortfall). |
| Risk Measure Type | Quantile-based risk measure. | Tail-average or coherent risk measure. |
| Mathematical Formulation | VaR\(_\alpha\) = \(\inf\{x \in \mathbb{R} : P(Loss \leq x) \geq \alpha\}\) | CVaR\(_\alpha\) = \(E[Loss | Loss > VaR_\alpha]\) |
| Focus | Focus on threshold loss at confidence level \(\alpha\). | Focus on average losses beyond the VaR threshold. |
| Coherence | Generally not coherent (violates subadditivity). | Coherent risk measure (satisfies subadditivity, translation invariance). |
| Use Case | Commonly used for regulatory capital calculation and risk reporting. | Preferred for risk management when tail risk assessment is crucial. |
| Limitation | Does not capture the magnitude of losses beyond the VaR level. | Provides a more comprehensive view of extreme losses but is computationally intensive. |
| Interpretation | Loss not exceeded with probability \(\alpha\). | Expected loss assuming that the loss is already beyond VaR at level \(\alpha\). |
Tail Risk
Tail risk refers to the extreme risk of rare events occurring in financial markets that produce significant losses, typically located in the far ends (tails) of a probability distribution. These events have low probability but high impact, such as market crashes or systemic crises. Quantitative measures like Value at Risk (VaR) and Expected Shortfall (ES) evaluate potential tail risk, assisting in managing portfolio exposures. Tail risk management strategies include diversification, hedging with options, and stress testing to mitigate the impact of unlikely yet severe financial downturns.
Loss Distribution
Loss distribution in finance quantifies the probability and magnitude of potential financial losses within a portfolio or investment. It incorporates statistical models such as Value at Risk (VaR) and Expected Shortfall to estimate the likelihood of losses exceeding certain thresholds over specific time horizons. By analyzing historical market data and stress testing scenarios, financial institutions assess risk exposure and maintain regulatory compliance under frameworks like Basel III. Accurate loss distribution modeling enhances risk management strategies, capital allocation, and decision-making in trading and portfolio optimization.
Confidence Level
Confidence level in finance represents the probability that a given value, such as an estimated return or risk measure, falls within a specified range. Common confidence levels used in financial risk management are 90%, 95%, and 99%, reflecting different degrees of certainty in the results. This metric is crucial for Value at Risk (VaR) calculations, portfolio optimization, and stress testing, enabling investors and analysts to quantify uncertainty. Regulatory frameworks like Basel III require banks to maintain capital reserves based on confidence levels to mitigate financial risks effectively.
Quantile
A quantile in finance represents a point or value dividing a probability distribution into intervals with equal probabilities, commonly used in risk assessment. For instance, the 0.95 quantile (95th percentile) of portfolio returns helps identify potential losses not exceeded 95% of the time, aiding Value at Risk (VaR) calculations. Financial analysts utilize quantiles to assess distributions of asset returns, credit losses, and economic indicators, improving decision-making under uncertainty. Quantile regression models provide robust estimates of conditional quantiles, enhancing risk management and investment strategies.
Risk Measures
Risk measures in finance quantify the potential losses associated with investment portfolios or financial assets. Value at Risk (VaR) is a widely used metric that estimates the maximum expected loss over a specific time horizon at a given confidence level, typically 95% or 99%. Conditional Value at Risk (CVaR), also known as Expected Shortfall, captures the average loss beyond the VaR threshold, providing insight into tail risk. Other important risk measures include standard deviation, beta, and the Sharpe ratio, which help investors assess volatility, market risk, and risk-adjusted returns respectively.
Source and External Links
Value at Risk - VaR estimates the maximum potential loss of an investment over a specified period for a given probability, but does not capture losses beyond that threshold.
Conditional Value at Risk: CVaR vs: VaR: A Comparative Analysis - CVaR measures the expected loss *beyond* the VaR threshold, capturing the average loss in the worst-case tail scenarios, thus addressing VaR's limitation in accounting for extreme losses.
Conditional Value at Risk (CVaR) - MATLAB and Simulink - CVaR, also known as expected shortfall, quantifies the average loss in the tail beyond a confidence level and is increasingly used for market risk capital calculations and portfolio optimization, supplanting VaR in some regulatory frameworks.
FAQs
What is Value-at-Risk?
Value-at-Risk (VaR) quantifies the maximum potential loss of a financial portfolio over a specified time period at a given confidence level, commonly used for risk management and regulatory capital calculation.
What is Conditional Value-at-Risk?
Conditional Value-at-Risk (CVaR) is a risk assessment measure that quantifies the expected loss exceeding the Value-at-Risk (VaR) threshold at a specified confidence level, providing a more comprehensive evaluation of tail risk in financial portfolios.
How do VaR and CVaR differ in risk measurement?
VaR measures the maximum potential loss at a specific confidence level without detailing tail losses, while CVaR provides the expected loss exceeding the VaR threshold, capturing tail risk more comprehensively.
What methods are used to calculate VaR and CVaR?
VaR and CVaR are calculated using historical simulation, variance-covariance (parametric) method, Monte Carlo simulation, and the Cornish-Fisher expansion for non-normal distributions.
Why is CVaR considered more informative than VaR for tail risk?
CVaR provides a more informative measure of tail risk than VaR by capturing the expected loss beyond the VaR threshold, reflecting the average severity of extreme losses instead of only the cutoff point.
In which scenarios should CVaR be preferred over VaR?
CVaR should be preferred over VaR in scenarios requiring assessment of tail risk, such as stress testing, portfolio optimization under extreme losses, and risk management involving heavy-tailed or non-normal loss distributions.
What are the limitations of using VaR and CVaR in risk management?
VaR limits include ignoring tail risk beyond the threshold, lack of subadditivity violating diversification principles, sensitivity to model assumptions, and providing no information about the magnitude of extreme losses. CVaR addresses tail risk but depends heavily on accurate loss distribution models, can be computationally intensive, and may suffer from estimation errors in small sample sizes.