The Sharpe Ratio measures risk-adjusted return by comparing portfolio excess return to its total volatility, providing a broad assessment of performance. The Sortino Ratio refines this by focusing only on downside volatility, offering a clearer picture of downside risk and potential losses. Explore deeper insights into when to apply each metric for optimal investment analysis.
Main Difference
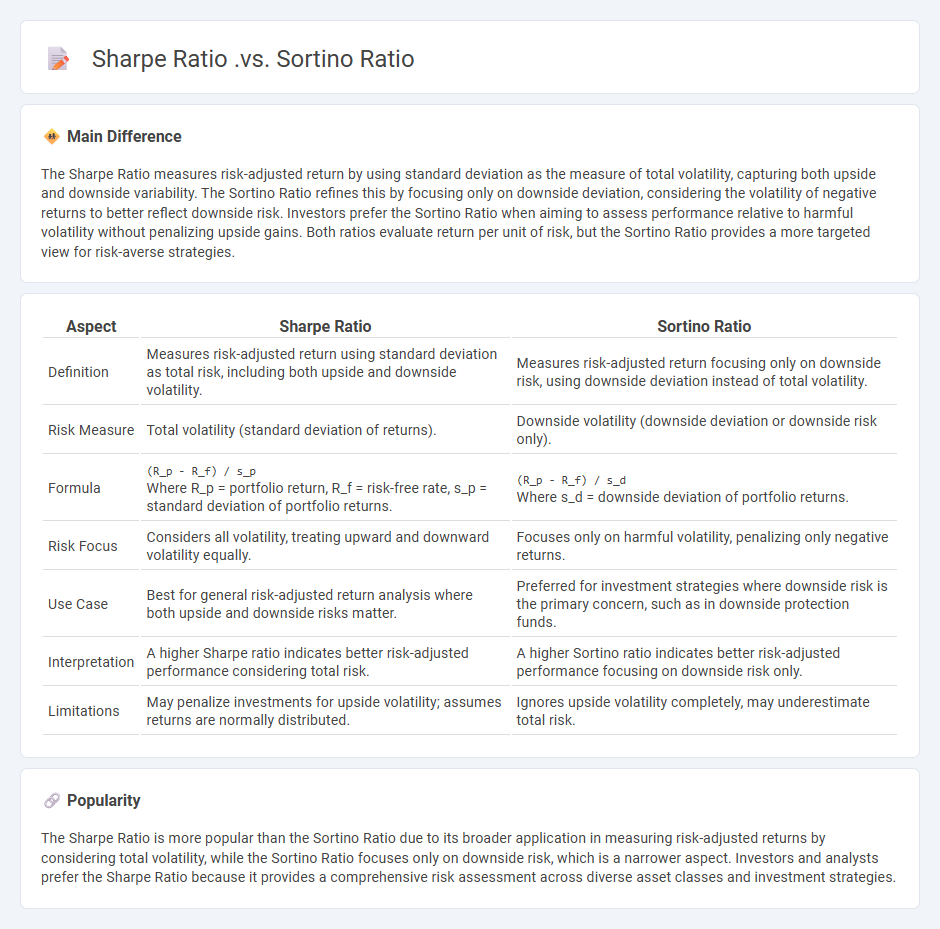
The Sharpe Ratio measures risk-adjusted return by using standard deviation as the measure of total volatility, capturing both upside and downside variability. The Sortino Ratio refines this by focusing only on downside deviation, considering the volatility of negative returns to better reflect downside risk. Investors prefer the Sortino Ratio when aiming to assess performance relative to harmful volatility without penalizing upside gains. Both ratios evaluate return per unit of risk, but the Sortino Ratio provides a more targeted view for risk-averse strategies.
Connection
The Sharpe Ratio and Sortino Ratio both measure risk-adjusted returns by comparing portfolio performance to risk, but the Sharpe Ratio uses total volatility (standard deviation) as the risk measure while the Sortino Ratio focuses only on downside volatility, emphasizing negative returns. Both ratios help investors evaluate investment efficiency, with the Sortino Ratio providing a more targeted assessment by penalizing harmful volatility instead of overall fluctuations. These metrics are essential for portfolio optimization, highlighting risk-return trade-offs under different risk considerations.
Comparison Table
| Aspect | Sharpe Ratio | Sortino Ratio |
|---|---|---|
| Definition | Measures risk-adjusted return using standard deviation as total risk, including both upside and downside volatility. | Measures risk-adjusted return focusing only on downside risk, using downside deviation instead of total volatility. |
| Risk Measure | Total volatility (standard deviation of returns). | Downside volatility (downside deviation or downside risk only). |
| Formula | (R_p - R_f) / s_pWhere R_p = portfolio return, R_f = risk-free rate, s_p = standard deviation of portfolio returns. |
(R_p - R_f) / s_dWhere s_d = downside deviation of portfolio returns. |
| Risk Focus | Considers all volatility, treating upward and downward volatility equally. | Focuses only on harmful volatility, penalizing only negative returns. |
| Use Case | Best for general risk-adjusted return analysis where both upside and downside risks matter. | Preferred for investment strategies where downside risk is the primary concern, such as in downside protection funds. |
| Interpretation | A higher Sharpe ratio indicates better risk-adjusted performance considering total risk. | A higher Sortino ratio indicates better risk-adjusted performance focusing on downside risk only. |
| Limitations | May penalize investments for upside volatility; assumes returns are normally distributed. | Ignores upside volatility completely, may underestimate total risk. |
Risk-adjusted return
Risk-adjusted return measures the profitability of an investment relative to the risk taken, often utilizing metrics like the Sharpe ratio, Treynor ratio, or Sortino ratio. It accounts for volatility, drawdowns, and market fluctuations to provide a clearer comparison between diverse asset classes. Investors use risk-adjusted returns to optimize portfolio allocations, balancing expected returns against potential losses. Quantitative models and historical data enhance the precision of these assessments in modern financial analysis.
Standard deviation
Standard deviation in finance measures the volatility or risk of an asset's returns by quantifying the dispersion of historical price data from its mean. It is a key metric used to assess investment risk, with higher standard deviation indicating greater variability and potential uncertainty in returns. Portfolio managers utilize standard deviation to evaluate the consistency of returns and to balance risk across diversified assets. Financial analysts often compare the standard deviation of different securities to inform investment decisions and optimize asset allocation.
Downside deviation
Downside deviation is a risk measure used in finance to evaluate the volatility of negative returns relative to a target or minimal acceptable return, highlighting potential losses rather than overall variability. It focuses exclusively on the negative fluctuations of an asset's returns, providing investors with a more precise assessment of downside risk compared to standard deviation. Widely applied in portfolio management and risk assessment, downside deviation helps in constructing portfolios with controlled exposure to unfavorable outcomes. Real-world applications often include comparison to benchmarks like the risk-free rate or target returns, aligning with risk-averse investment strategies.
Excess return
Excess return in finance represents the investment's return above the risk-free rate, often measured against benchmarks like U.S. Treasury yields or the S&P 500 index. This metric is crucial for evaluating portfolio performance and investment strategies, capturing the premium earned for taking on additional risk. Quantitative models such as the Capital Asset Pricing Model (CAPM) use excess return to estimate an asset's expected return based on its beta and market risk. Investors use excess return to identify alpha, indicating outperformance relative to market expectations.
Performance evaluation
Performance evaluation in finance involves assessing investment returns, risk management, and portfolio efficiency using quantitative metrics such as the Sharpe ratio, alpha, and beta. Financial analysts measure performance by comparing realized returns against benchmarks like the S&P 500 or risk-free rates. Advanced techniques include attribution analysis to identify sources of investment performance and stress testing to evaluate resilience under market volatility. Accurate performance evaluation guides strategic decision-making, improves asset allocation, and enhances overall financial management.
Source and External Links
Sharpe vs Sortino: Risk Metrics for Growth Companies - The Sharpe ratio measures total volatility (upside and downside) making it ideal for long-term, balanced growth, while the Sortino ratio focuses only on downside risk, suiting short-term, high-volatility scenarios emphasizing loss minimization.
Sortino ratio vs. Sharpe ratio - Meaning, Calculation & Comparison - The Sharpe ratio assesses risk-adjusted returns using total standard deviation, including positive and negative volatility, whereas the Sortino ratio only penalizes downside deviation, making it preferable for risk-averse investors focused on avoiding losses.
Sortino Ratio vs Sharpe Ratio - Key Differences - Bajaj Finserv - Unlike the Sharpe ratio, which penalizes all volatility, the Sortino ratio concentrates on downside risk by using the standard deviation of negative returns, thus providing a metric that better distinguishes detrimental volatility in evaluating risk-adjusted returns.
FAQs
What is the Sharpe Ratio?
The Sharpe Ratio measures an investment's risk-adjusted return by calculating the average excess return over the risk-free rate divided by the standard deviation of returns.
What is the Sortino Ratio?
The Sortino Ratio measures risk-adjusted return by comparing the excess return of an investment to its downside deviation, focusing only on negative volatility.
How does the Sharpe Ratio differ from the Sortino Ratio?
The Sharpe Ratio measures risk-adjusted return using total portfolio volatility, while the Sortino Ratio focuses on downside volatility, evaluating returns relative to harmful downside risk only.
What does the Sharpe Ratio measure?
The Sharpe Ratio measures the risk-adjusted return of an investment by comparing its excess return to the standard deviation of its returns.
What does the Sortino Ratio measure?
The Sortino Ratio measures risk-adjusted return by evaluating the return of an investment relative to its downside volatility, focusing only on negative deviations from a target or minimum acceptable return.
Why would an investor prefer the Sortino Ratio over the Sharpe Ratio?
An investor prefers the Sortino Ratio over the Sharpe Ratio because it measures risk-adjusted returns by focusing only on downside volatility, providing a more accurate assessment of harmful volatility and potential losses.
When should you use the Sharpe Ratio instead of the Sortino Ratio?
Use the Sharpe Ratio instead of the Sortino Ratio when assessing a portfolio's overall risk by considering both upside and downside volatility, especially if the investor seeks a balanced view of total return variability rather than focusing solely on downside risk.