The yield curve represents the relationship between bond yields and their maturities, reflecting market expectations for interest rates and economic activity over time. The spot rate curve, or zero-coupon yield curve, shows the yields on zero-coupon bonds for different maturities, providing a precise measure of the term structure of interest rates. Explore the differences and implications of yield curve versus spot rate curve for deeper financial insights.
Main Difference
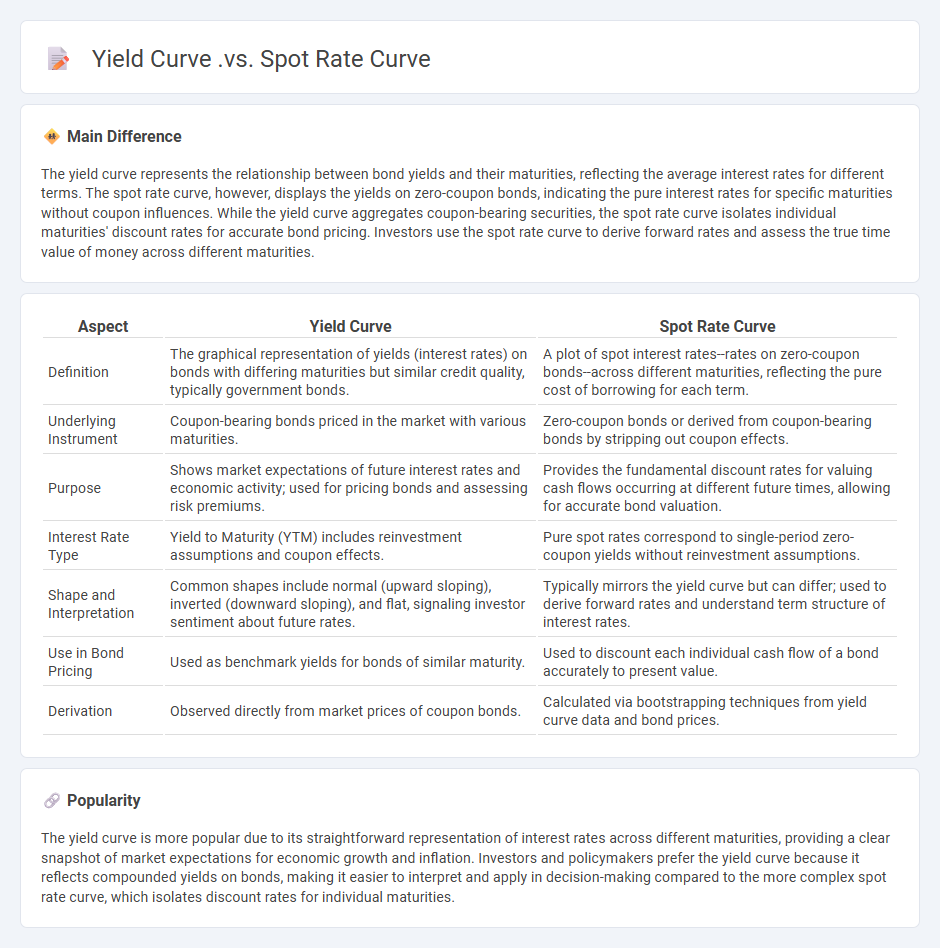
The yield curve represents the relationship between bond yields and their maturities, reflecting the average interest rates for different terms. The spot rate curve, however, displays the yields on zero-coupon bonds, indicating the pure interest rates for specific maturities without coupon influences. While the yield curve aggregates coupon-bearing securities, the spot rate curve isolates individual maturities' discount rates for accurate bond pricing. Investors use the spot rate curve to derive forward rates and assess the true time value of money across different maturities.
Connection
The yield curve represents the relationship between bond yields and their maturities, while the spot rate curve shows the yields of zero-coupon bonds at different maturities. The spot rate curve is derived from the yield curve through bootstrapping, extracting the pure interest rates for each maturity without reinvestment risk. This connection allows investors to price bonds accurately and assess the term structure of interest rates.
Comparison Table
| Aspect | Yield Curve | Spot Rate Curve |
|---|---|---|
| Definition | The graphical representation of yields (interest rates) on bonds with differing maturities but similar credit quality, typically government bonds. | A plot of spot interest rates--rates on zero-coupon bonds--across different maturities, reflecting the pure cost of borrowing for each term. |
| Underlying Instrument | Coupon-bearing bonds priced in the market with various maturities. | Zero-coupon bonds or derived from coupon-bearing bonds by stripping out coupon effects. |
| Purpose | Shows market expectations of future interest rates and economic activity; used for pricing bonds and assessing risk premiums. | Provides the fundamental discount rates for valuing cash flows occurring at different future times, allowing for accurate bond valuation. |
| Interest Rate Type | Yield to Maturity (YTM) includes reinvestment assumptions and coupon effects. | Pure spot rates correspond to single-period zero-coupon yields without reinvestment assumptions. |
| Shape and Interpretation | Common shapes include normal (upward sloping), inverted (downward sloping), and flat, signaling investor sentiment about future rates. | Typically mirrors the yield curve but can differ; used to derive forward rates and understand term structure of interest rates. |
| Use in Bond Pricing | Used as benchmark yields for bonds of similar maturity. | Used to discount each individual cash flow of a bond accurately to present value. |
| Derivation | Observed directly from market prices of coupon bonds. | Calculated via bootstrapping techniques from yield curve data and bond prices. |
Yield to Maturity (YTM)
Yield to Maturity (YTM) measures the total return an investor can expect if a bond is held until it matures, expressed as an annual rate. It factors in the bond's current market price, face value, coupon interest payments, and time remaining until maturity. Calculating YTM involves solving for the discount rate that equates the bond's present value of future cash flows to its current price. Investors use YTM to compare bonds with different maturities and coupon rates, aiding in portfolio optimization and risk assessment.
Zero-Coupon Bond
A zero-coupon bond is a fixed-income security that does not pay periodic interest or coupons, instead being issued at a significant discount to its face value. The bond's yield is derived from the difference between the purchase price and the amount paid at maturity, typically over a period ranging from one to thirty years. These bonds are commonly used by investors seeking long-term, predictable returns or by entities looking to raise capital without immediate interest obligations. Prominent issuers of zero-coupon bonds include governments, municipalities, and corporations, with U.S. Treasury STRIPS as a notable example.
Forward Rate
Forward rate in finance represents the agreed interest rate for a loan or investment to be initiated at a future date, derived from current spot rates and yield curve data. It plays a crucial role in interest rate risk management, pricing of forward rate agreements (FRAs), and bond valuation by forecasting future cost of funds or returns. Financial professionals utilize forward rates to anticipate monetary policy shifts and to hedge against potential fluctuations in interest rates. Market instruments such as swaps and futures contracts rely heavily on forward rate calculations for accurate pricing and risk assessment.
Par Yield Curve
The yield curve represents the relationship between interest rates and the maturity of debt securities, typically government bonds, plotted graphically. It is a key indicator of economic expectations, illustrating short-term to long-term interest rate differentials. A normal upward-sloping yield curve suggests economic growth, while an inverted yield curve often signals potential recession risks. Market participants use yield curve analysis to guide investment decisions and predict inflation trends.
Term Structure of Interest Rates
The term structure of interest rates illustrates the relationship between bond yields and their maturities, commonly depicted by the yield curve. It serves as a crucial indicator for forecasting economic activity and guiding monetary policy decisions set by institutions like the Federal Reserve. Short-term rates often react to central bank policies, while long-term rates reflect market expectations about future inflation and economic growth. Understanding this structure assists investors in assessing risk, optimizing portfolio duration, and pricing fixed-income securities accurately.
Source and External Links
Introduction to Spot Yield Curve and Yield Curve Analysis - The spot yield curve shows the yield on zero-coupon securities for each maturity and is used to discount individual future cash flows precisely, while the yield curve typically refers to coupon-bearing bonds' yields across maturities; spot rates provide exact discounting rates unlike par or coupon yields which mix cash flow timings.
Spot Curve, Par Curve, and Forward Curve Explained - The spot curve differs from the yield (par) curve in that spot rates are yields on zero-coupon bonds for each maturity, accurately reflecting discounting rates, whereas par yields represent yields-to-maturity of bonds priced at par and tend to lie close but not identical to spot rates depending on the curve's slope.
Euro Area Yield Curves - European Central Bank - The yield curve plots market interest rates versus maturities, including par, forward, and zero-coupon (spot) curves; the zero-coupon (spot) curve is derived from hypothetical zero-coupon bonds used for discounting, while the par curve reflects yields on bonds priced at par, and the forward curve indicates future short-term interest rates implied by spot rates.
FAQs
What is a yield curve?
A yield curve is a graph showing the relationship between interest rates and the maturity dates of debt securities, typically government bonds, illustrating market expectations for interest rates and economic activity.
What is a spot rate curve?
A spot rate curve is a graph depicting the relationship between spot interest rates and different maturities of zero-coupon bonds, reflecting the yield for immediate investment periods.
How do yield curve and spot rate curve differ?
The yield curve shows the relationship between bond yields and maturities based on yield to maturity, while the spot rate curve represents zero-coupon bond rates at different maturities, reflecting pure discount rates without reinvestment risk.
What information does the yield curve provide?
The yield curve provides information about the relationship between bond yields and their maturities, indicating investor expectations for future interest rates, economic growth, and potential inflation.
How is a spot rate curve constructed?
A spot rate curve is constructed by deriving zero-coupon bond yields from current market prices of various fixed-income securities, using bootstrapping to sequentially calculate spot rates for increasing maturities.
Why are spot rates important for bond pricing?
Spot rates are important for bond pricing because they provide the precise discount factors for each future cash flow, ensuring accurate valuation by reflecting the time value of money and interest rate risk at different maturities.
How do investors use yield curves and spot rate curves?
Investors use yield curves to assess interest rate expectations and economic conditions by analyzing different maturities' bond yields, while spot rate curves help them precisely price bonds and determine the present value of future cash flows for accurate investment valuation.