The Efficient Frontier represents a set of optimal portfolios offering the highest expected return for a defined level of risk, based on Modern Portfolio Theory. The Capital Market Line (CML) extends the Efficient Frontier by incorporating a risk-free asset, illustrating the risk-return trade-off for efficient portfolios when blending risky assets with risk-free borrowing or lending. Explore the distinctions and applications of these foundational concepts in portfolio optimization to enhance investment strategies.
Main Difference
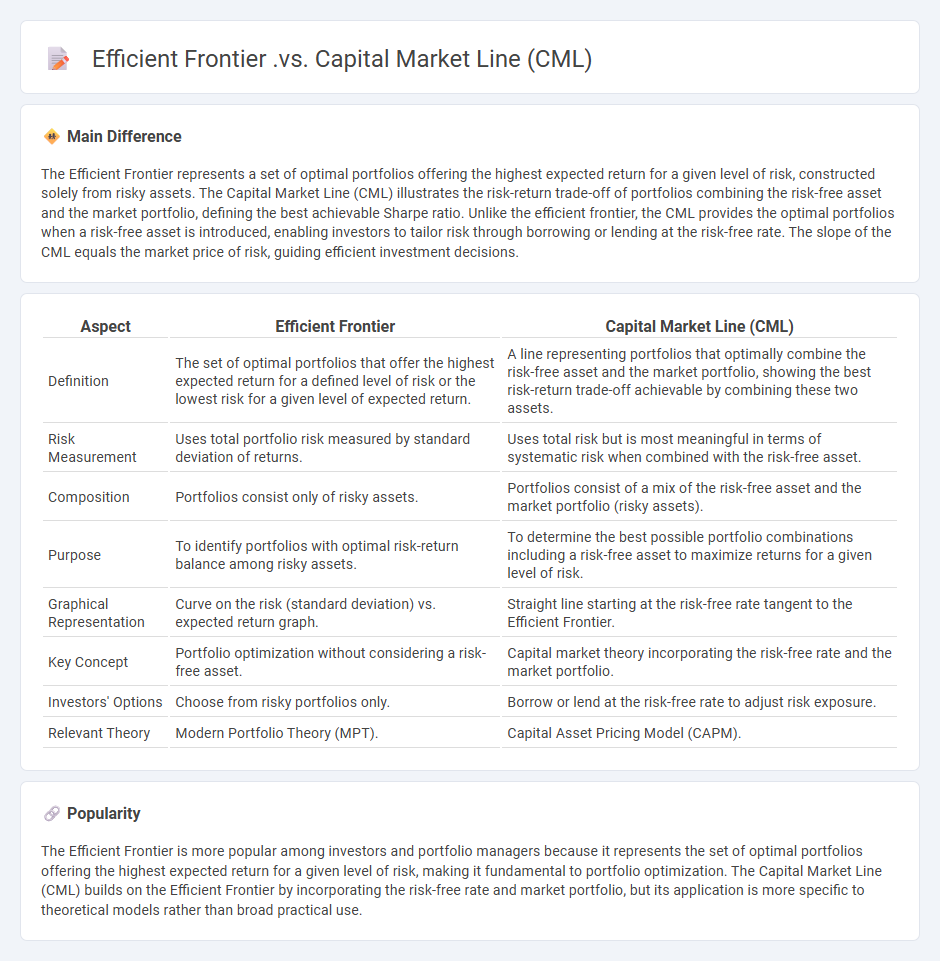
The Efficient Frontier represents a set of optimal portfolios offering the highest expected return for a given level of risk, constructed solely from risky assets. The Capital Market Line (CML) illustrates the risk-return trade-off of portfolios combining the risk-free asset and the market portfolio, defining the best achievable Sharpe ratio. Unlike the efficient frontier, the CML provides the optimal portfolios when a risk-free asset is introduced, enabling investors to tailor risk through borrowing or lending at the risk-free rate. The slope of the CML equals the market price of risk, guiding efficient investment decisions.
Connection
The Efficient Frontier represents the set of optimal portfolios offering the highest expected return for a given level of risk, based on diversification of risky assets. The Capital Market Line (CML) extends from the risk-free rate to the market portfolio on the Efficient Frontier, illustrating combinations of risk-free assets and market portfolios optimized for maximum Sharpe ratio. Investors use the CML to identify the best risk-return trade-off by blending the risk-free asset with the efficient market portfolio.
Comparison Table
| Aspect | Efficient Frontier | Capital Market Line (CML) |
|---|---|---|
| Definition | The set of optimal portfolios that offer the highest expected return for a defined level of risk or the lowest risk for a given level of expected return. | A line representing portfolios that optimally combine the risk-free asset and the market portfolio, showing the best risk-return trade-off achievable by combining these two assets. |
| Risk Measurement | Uses total portfolio risk measured by standard deviation of returns. | Uses total risk but is most meaningful in terms of systematic risk when combined with the risk-free asset. |
| Composition | Portfolios consist only of risky assets. | Portfolios consist of a mix of the risk-free asset and the market portfolio (risky assets). |
| Purpose | To identify portfolios with optimal risk-return balance among risky assets. | To determine the best possible portfolio combinations including a risk-free asset to maximize returns for a given level of risk. |
| Graphical Representation | Curve on the risk (standard deviation) vs. expected return graph. | Straight line starting at the risk-free rate tangent to the Efficient Frontier. |
| Key Concept | Portfolio optimization without considering a risk-free asset. | Capital market theory incorporating the risk-free rate and the market portfolio. |
| Investors' Options | Choose from risky portfolios only. | Borrow or lend at the risk-free rate to adjust risk exposure. |
| Relevant Theory | Modern Portfolio Theory (MPT). | Capital Asset Pricing Model (CAPM). |
Efficient Frontier
The Efficient Frontier represents the set of optimal investment portfolios that offer the highest expected return for a defined level of risk, based on Modern Portfolio Theory introduced by Harry Markowitz. It is plotted on a graph where the x-axis indicates portfolio risk (standard deviation) and the y-axis shows expected return. Portfolios lying on the Efficient Frontier are considered optimal because they maximize returns for their risk level, unlike portfolios below the curve that are suboptimal. Financial analysts use the Efficient Frontier to guide asset allocation decisions and enhance portfolio performance by balancing risk and reward.
Capital Market Line (CML)
Capital Market Line (CML) represents the risk-return trade-off of efficient portfolios that combine a risk-free asset with the market portfolio in finance. It is derived from the Capital Asset Pricing Model (CAPM) and shows the maximal expected return for a given level of portfolio risk measured by standard deviation. The slope of the CML equals the market price of risk, calculated as the Sharpe ratio of the market portfolio. Investors use the CML to construct optimal portfolios by adjusting the proportion invested in the market portfolio versus the risk-free asset.
Risk-Return Tradeoff
The risk-return tradeoff in finance represents the principle that potential return rises with an increase in risk. Investors must evaluate the balance between the expected returns of an investment and the level of risk they are willing to accept. Asset classes like stocks typically offer higher returns but come with greater volatility compared to bonds, which provide more stable income but lower yields. Portfolio diversification is a key strategy to optimize this tradeoff, aiming to maximize returns while managing and mitigating risks.
Portfolio Optimization
Portfolio optimization in finance involves selecting the best asset allocation to maximize returns while minimizing risk, based on an investor's risk tolerance and investment goals. Techniques such as Mean-Variance Optimization, introduced by Harry Markowitz, use historical return data and covariance matrices to balance expected returns against portfolio volatility. Constraints like budget limits, investment bounds, and regulatory requirements are integrated into mathematical models to ensure practical feasibility. Advanced methods incorporate factors such as transaction costs, tax considerations, and multi-period investment horizons for dynamic portfolio adjustment.
Market Portfolio
The market portfolio represents a comprehensive collection of all investable assets weighted by their market capitalization, serving as a benchmark for evaluating portfolio performance in finance. It plays a crucial role in the Capital Asset Pricing Model (CAPM), where the expected return of an asset is determined relative to its risk compared to the market portfolio. Investors use the market portfolio to achieve optimal diversification, minimizing unsystematic risk while being exposed only to systematic risk. Major stock indices like the S&P 500 or MSCI World Index often approximate the market portfolio in practical applications.
Source and External Links
Capital Market Theory - PORTFOLIO MANAGEMENT - PrepNuggets - The Efficient Frontier represents the set of optimal risky portfolios, while the Capital Market Line (CML) is the capital allocation line that is tangent to this frontier, representing combinations of the risk-free asset and the market portfolio, assumed optimal for all investors with homogeneous expectations.
Difference between Capital Allocation Line (CAL), Capital Market Line (CML), Security Market Line (SML) | GraduateTutor - The CML is a special case of the Capital Allocation Line where the risky asset is the market portfolio, showing the risk-return trade-off for portfolios mixing the risk-free asset and market portfolio; whereas the Efficient Frontier shows the best risk-return combinations of risky assets only.
Capital Market Line (CML) - SimTrade blog - When including a risk-free asset, the Efficient Frontier becomes the Capital Market Line, a straight line connecting the risk-free asset and the tangency portfolio (market portfolio), illustrating that investors increase expected return by taking on more risk beyond the risk-free rate; the slope of the CML equals the Sharpe ratio of the market portfolio.
FAQs
What is the efficient frontier in portfolio theory?
The efficient frontier in portfolio theory represents the set of optimal portfolios offering the highest expected return for a given level of risk or the lowest risk for a given expected return.
What is the Capital Market Line CML?
The Capital Market Line (CML) represents the risk-return trade-off of efficient portfolios combining the risk-free asset and the market portfolio, showing the highest expected return for a given level of risk measured by standard deviation.
How does the efficient frontier differ from the CML?
The efficient frontier represents the set of optimal portfolios offering the highest expected return for a given level of risk without considering a risk-free asset, while the Capital Market Line (CML) includes the risk-free asset and shows the risk-return trade-off for efficient portfolios combining the market portfolio and the risk-free asset.
What role does risk play in the efficient frontier and CML?
Risk, measured by portfolio variance or standard deviation, determines the position on the efficient frontier and the Capital Market Line (CML), where investors maximize expected return for a given risk level.
How are optimal portfolios determined using the efficient frontier and CML?
Optimal portfolios are determined by selecting portfolios on the efficient frontier that maximize expected return for a given level of risk, with the Capital Market Line (CML) identifying the tangent portfolio combining the risk-free asset and the market portfolio, which offers the highest Sharpe ratio and represents the optimal risky portfolio for investors.
What is the significance of the tangency point on the efficient frontier and CML?
The tangency point on the efficient frontier and Capital Market Line (CML) represents the optimal risky portfolio with the highest Sharpe ratio, achieving the best risk-return trade-off for investors.
Why is the Capital Market Line considered superior to the efficient frontier for investors?
The Capital Market Line is considered superior because it incorporates a risk-free asset, enabling investors to achieve higher expected returns for a given level of risk through optimal combinations of the market portfolio and risk-free asset, unlike the efficient frontier which only includes risky assets.