Beta coefficient measures a stock's volatility relative to the overall market, indicating systematic risk, while Alpha coefficient represents the excess return of an investment compared to a benchmark index, reflecting performance relative to expected risk-adjusted returns. Understanding the distinction between Beta and Alpha is crucial for portfolio management and risk assessment. Explore deeper insights on how Beta and Alpha coefficients influence investment strategies.
Main Difference
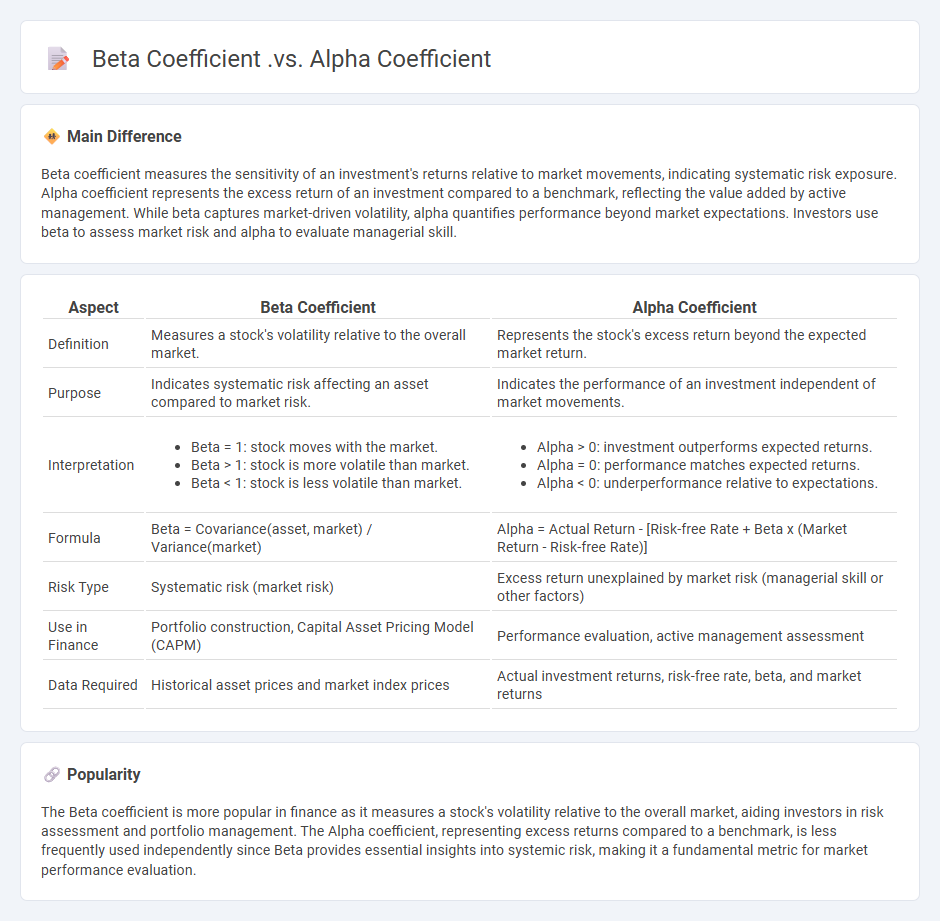
Beta coefficient measures the sensitivity of an investment's returns relative to market movements, indicating systematic risk exposure. Alpha coefficient represents the excess return of an investment compared to a benchmark, reflecting the value added by active management. While beta captures market-driven volatility, alpha quantifies performance beyond market expectations. Investors use beta to assess market risk and alpha to evaluate managerial skill.
Connection
Beta coefficient measures an investment's sensitivity to market movements, indicating systematic risk, while alpha coefficient represents the excess return of an investment relative to its expected performance based on Beta. Both coefficients are integral components of the Capital Asset Pricing Model (CAPM), where Beta quantifies market risk and Alpha indicates manager skill or investment outperformance. Understanding their relationship helps investors assess risk-adjusted returns and optimize portfolio decisions.
Comparison Table
| Aspect | Beta Coefficient | Alpha Coefficient |
|---|---|---|
| Definition | Measures a stock's volatility relative to the overall market. | Represents the stock's excess return beyond the expected market return. |
| Purpose | Indicates systematic risk affecting an asset compared to market risk. | Indicates the performance of an investment independent of market movements. |
| Interpretation |
|
|
| Formula | Beta = Covariance(asset, market) / Variance(market) | Alpha = Actual Return - [Risk-free Rate + Beta x (Market Return - Risk-free Rate)] |
| Risk Type | Systematic risk (market risk) | Excess return unexplained by market risk (managerial skill or other factors) |
| Use in Finance | Portfolio construction, Capital Asset Pricing Model (CAPM) | Performance evaluation, active management assessment |
| Data Required | Historical asset prices and market index prices | Actual investment returns, risk-free rate, beta, and market returns |
Systematic Risk
Systematic risk refers to the inherent market risk that affects the entire financial system and cannot be eliminated through diversification. It encompasses factors such as economic recessions, interest rate changes, inflation, and geopolitical instability that impact all securities and asset classes simultaneously. Investors measure systematic risk using beta, which quantifies an asset's sensitivity to market movements. Understanding systematic risk is crucial for portfolio management and asset pricing models like the Capital Asset Pricing Model (CAPM).
Market Benchmark
Market benchmark in finance refers to a standard or point of reference against which the performance of investment portfolios, assets, or funds is measured. Common benchmarks include indices like the S&P 500, MSCI World Index, or Bloomberg Barclays U.S. Aggregate Bond Index. Investors and portfolio managers use these benchmarks to evaluate returns, risk-adjusted performance, and asset allocation effectiveness. Accurate market benchmarking is crucial for assessing investment strategies and making informed financial decisions.
Risk-Adjusted Return
Risk-adjusted return measures an investment's profitability by accounting for the level of risk involved, enabling comparison across diverse assets. Common metrics include the Sharpe Ratio, which evaluates excess return per unit of volatility, and the Sortino Ratio, focusing on downside risk. These indicators are crucial for portfolio managers seeking to optimize asset allocation and improve risk management strategies. Evaluating risk-adjusted returns ensures investment decisions align with an investor's risk tolerance and financial goals.
Volatility Measurement
Volatility measurement in finance quantifies the degree of variation in asset prices over time, serving as a key indicator of market risk. Common metrics include historical volatility, calculated from past price data, and implied volatility, derived from options prices reflecting market expectations. The standard deviation of returns is a fundamental statistical tool used to gauge price fluctuations, while advanced models like GARCH capture volatility clustering and time-varying risk. Accurate volatility measurement supports portfolio management, derivative pricing, and risk assessment strategies in financial markets.
Portfolio Performance
Portfolio performance measures the returns generated by a collection of investments over a specific period, reflecting the effectiveness of asset allocation and risk management strategies. Key metrics include total return, alpha, beta, and Sharpe ratio, which assess profitability, market correlation, and risk-adjusted performance. Diversification across equities, bonds, and alternative assets like real estate or commodities can enhance returns while mitigating volatility. Benchmark comparisons, such as against the S&P 500 or MSCI World Index, help investors evaluate portfolio success relative to market standards.
Source and External Links
Alpha vs. Beta In Stock Investing: Definition & Comparison - Alpha measures the excess return of an investment relative to a benchmark (performance), while Beta measures the volatility or market risk relative to that benchmark.
Difference between alpha and beta for investors - Alpha indicates how much an investment has outperformed or underperformed a market index, expressed as a percentage, whereas Beta quantifies the investment's volatility relative to the index, with a Beta of 1 meaning equal volatility.
Alpha and beta | Investment companies | Achievable Series 7 - Beta represents the sensitivity of an investment's returns to market movements (volatility), with values above 1 implying higher volatility and below 1 implying lower, while Alpha reflects the actual over- or underperformance compared to what Beta would predict.
FAQs
What is a coefficient in finance?
A coefficient in finance quantifies the relationship between variables, such as beta measuring a stock's volatility relative to the market.
What is the beta coefficient?
The beta coefficient measures a stock's volatility relative to the overall market, indicating its systematic risk.
What is the alpha coefficient?
The alpha coefficient, often called Cronbach's alpha, measures the internal consistency or reliability of a set of scale or test items.
What is the difference between beta and alpha coefficients?
Beta coefficients measure the sensitivity of an asset's returns relative to the overall market returns, indicating systematic risk; alpha coefficients represent the excess return of an investment relative to the expected return based on its beta, reflecting manager skill or unique factors.
How is the beta coefficient calculated?
The beta coefficient is calculated as the covariance of the asset's returns with the market's returns divided by the variance of the market's returns: \[ \beta = \frac{\text{Cov}(R_i, R_m)}{\text{Var}(R_m)} \] where \(R_i\) is the asset return and \(R_m\) is the market return.
How is the alpha coefficient calculated?
The alpha coefficient is calculated using Cronbach's alpha formula: a = (N / (N - 1)) * (1 - (Ss_i2 / s_total2)), where N is the number of items, s_i2 is the variance of each individual item, and s_total2 is the variance of the total test scores.
Why are alpha and beta coefficients important for investors?
Alpha and beta coefficients are important for investors because alpha measures an investment's excess return relative to a benchmark, indicating its ability to generate value, while beta assesses the investment's volatility and systematic risk compared to the market, guiding risk management and portfolio diversification decisions.