The Constant Dividend Growth Model assumes dividends increase at a steady, predictable rate, providing a simple way to value stocks with stable dividend patterns. In contrast, the Variable Dividend Growth Model accounts for fluctuating dividend growth rates, reflecting companies with irregular earnings and payout policies. Explore these models further to understand which fits your investment strategy best.
Main Difference
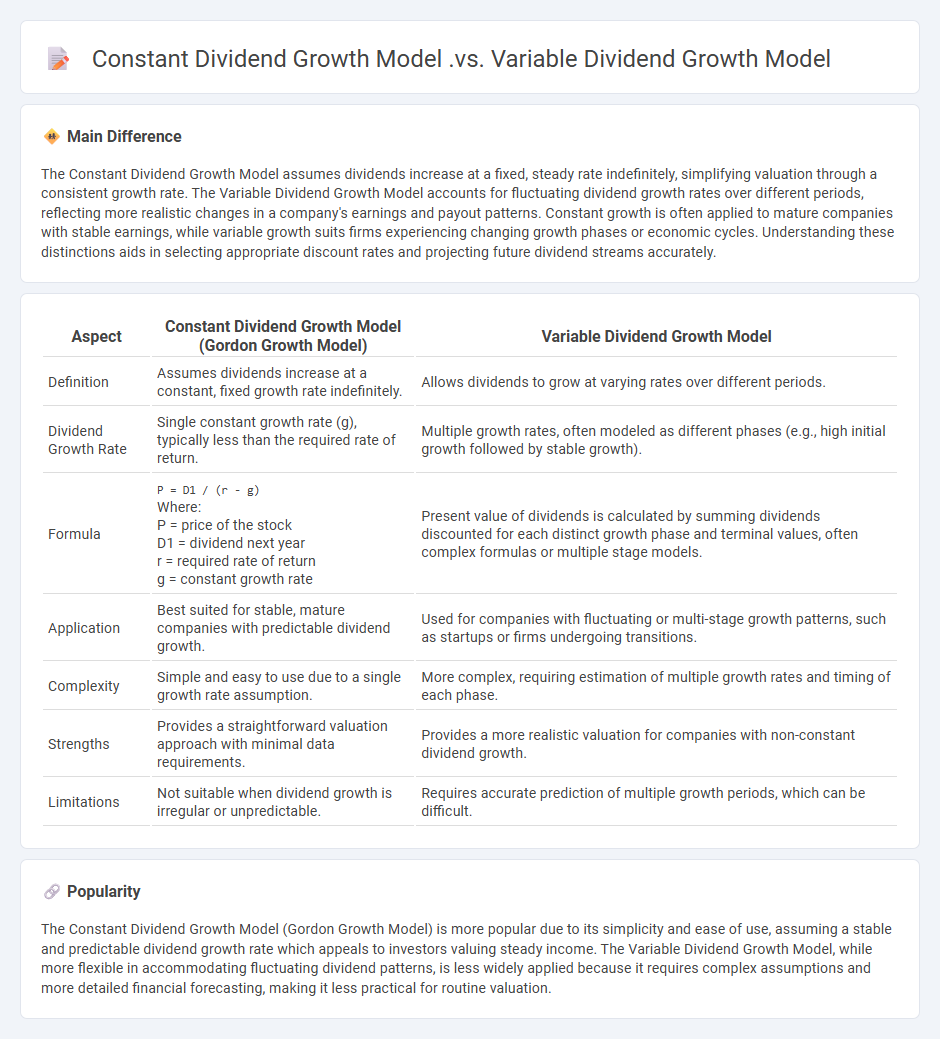
The Constant Dividend Growth Model assumes dividends increase at a fixed, steady rate indefinitely, simplifying valuation through a consistent growth rate. The Variable Dividend Growth Model accounts for fluctuating dividend growth rates over different periods, reflecting more realistic changes in a company's earnings and payout patterns. Constant growth is often applied to mature companies with stable earnings, while variable growth suits firms experiencing changing growth phases or economic cycles. Understanding these distinctions aids in selecting appropriate discount rates and projecting future dividend streams accurately.
Connection
The Constant Dividend Growth Model (Gordon Growth Model) assumes dividends grow at a fixed, perpetual rate, useful for valuing stable companies with predictable payout patterns. The Variable Dividend Growth Model extends this by accommodating multiple growth rates over different periods, reflecting more realistic dividend behaviors during company transitions or fluctuating earnings. Both models rely on the present value of expected dividends to estimate stock prices, making dividend growth rate a central factor in equity valuation.
Comparison Table
| Aspect | Constant Dividend Growth Model (Gordon Growth Model) | Variable Dividend Growth Model |
|---|---|---|
| Definition | Assumes dividends increase at a constant, fixed growth rate indefinitely. | Allows dividends to grow at varying rates over different periods. |
| Dividend Growth Rate | Single constant growth rate (g), typically less than the required rate of return. | Multiple growth rates, often modeled as different phases (e.g., high initial growth followed by stable growth). |
| Formula |
P = D1 / (r - g)Where: P = price of the stock D1 = dividend next year r = required rate of return g = constant growth rate |
Present value of dividends is calculated by summing dividends discounted for each distinct growth phase and terminal values, often complex formulas or multiple stage models. |
| Application | Best suited for stable, mature companies with predictable dividend growth. | Used for companies with fluctuating or multi-stage growth patterns, such as startups or firms undergoing transitions. |
| Complexity | Simple and easy to use due to a single growth rate assumption. | More complex, requiring estimation of multiple growth rates and timing of each phase. |
| Strengths | Provides a straightforward valuation approach with minimal data requirements. | Provides a more realistic valuation for companies with non-constant dividend growth. |
| Limitations | Not suitable when dividend growth is irregular or unpredictable. | Requires accurate prediction of multiple growth periods, which can be difficult. |
Dividend Growth Rate
Dividend growth rate measures the annualized percentage increase in a company's dividend payments over time, reflecting its profitability and financial health. Investors use the dividend growth rate to estimate future dividend income and assess the sustainability of dividend policies. The most common method to calculate this rate is the compound annual growth rate (CAGR) based on historical dividend data. Companies with stable and consistent dividend growth are often favored in income-focused investment strategies.
Predictability of Cash Flows
Predictability of cash flows is a critical factor in finance, influencing investment decisions, valuation models, and risk assessment. Stable and consistent cash flows enable accurate forecasting, enhancing the reliability of discounted cash flow (DCF) analyses used by financial analysts and investors. Companies with high cash flow predictability tend to have lower cost of capital due to reduced uncertainty, improving their access to financing. Financial institutions use cash flow predictability to evaluate creditworthiness and liquidity risks, ensuring sustainable operational performance.
Valuation Formula
The valuation formula in finance calculates the present value of an asset by discounting its expected future cash flows at an appropriate discount rate. Key models include the Discounted Cash Flow (DCF) method, which sums the present value of projected earnings to estimate intrinsic value. Market value approaches, such as the Comparable Company Analysis, compare financial metrics like Price-to-Earnings (P/E) ratios among similar companies. These valuation techniques are essential for investment decision-making, mergers and acquisitions, and portfolio management.
Model Assumptions
Model assumptions in finance underpin quantitative methods used to evaluate risk, price assets, and forecast market behavior. These assumptions often include market efficiency, rational investor behavior, constant volatility, and the normal distribution of returns. Key models like the Capital Asset Pricing Model (CAPM) assume investors hold diversified portfolios and markets are frictionless, impacting expected return calculations. Understanding these foundational assumptions is crucial for interpreting model outputs and their limitations in real-world financial analysis.
Applicability to Companies
Financial companies leverage advanced data analytics to optimize investment strategies and manage risks more effectively. Automation in financial services enhances transaction processing speed and accuracy, reducing operational costs. Regulatory technology (RegTech) helps firms comply with evolving laws by using AI-driven monitoring systems. Blockchain integration ensures transparent, secure transactions, boosting customer trust and reducing fraud.
Source and External Links
Dividend Discount Model | Overview, Formula & Examples - Study.com - The Constant Dividend Growth Model assumes dividends grow at a fixed rate perpetually and uses a simple formula to value the stock, while the Variable Dividend Growth Model divides dividend growth into multiple phases, reflecting a more realistic scenario with different growth rates over time.
Discounted Dividend Valuation | CFA Institute - The Constant Growth (Gordon Growth) Model assumes dividends grow at a constant rate forever and is widely used for stocks with stable growth, whereas the Variable Growth Model incorporates multiple growth phases to better capture changes in dividend growth over different time periods.
11.2 Dividend Discount Models (DDMs) - Principles of Finance - The Constant Growth Dividend Discount Model values stock based on dividends growing at a fixed constant rate indefinitely, while the Variable Growth Model, such as two-stage or three-stage models, calculates present values for distinct growth periods and sums them for intrinsic value, making it more flexible for companies with changing growth rates.
FAQs
What is the Constant Dividend Growth Model?
The Constant Dividend Growth Model (Gordon Growth Model) values a stock by assuming dividends grow at a constant rate, using the formula: Price = Dividend per share / (Discount rate - Dividend growth rate).
What is the Variable Dividend Growth Model?
The Variable Dividend Growth Model estimates a stock's intrinsic value by discounting expected dividends that grow at varying rates over different time periods.
How do the two models differ in dividend assumptions?
The first model assumes a fixed annual dividend growth rate of 5%, while the second model projects dividends based on a variable payout ratio tied to earnings forecasts.
When should you use the Constant Dividend Growth Model?
Use the Constant Dividend Growth Model when a company pays dividends that are expected to grow at a consistent, fixed rate indefinitely.
In what situations is the Variable Dividend Growth Model more appropriate?
The Variable Dividend Growth Model is more appropriate when a company's dividend growth rates change over different periods, such as an initial phase with high growth followed by a stable, constant growth phase.
What are the main limitations of each model?
Each model's main limitations include GPT-4's occasional factual inaccuracies and high computational cost, BERT's inability to generate text and limited context window, and CNNs' lack of sequential data understanding and reliance on fixed-size input.
How do these models impact stock valuation choices?
These models enhance stock valuation accuracy by integrating quantitative data, market trends, and risk assessments to inform investment decisions.