Piotroski Score and Altman Z-Score are key financial metrics used to evaluate a company's health and predict bankruptcy risk. Piotroski Score focuses on profitability, leverage, liquidity, and operational efficiency using nine accounting-based criteria, while Altman Z-Score combines five financial ratios including working capital, retained earnings, and market value to assess insolvency probability. Discover how these scores complement each other in financial analysis and credit risk assessment.
Main Difference
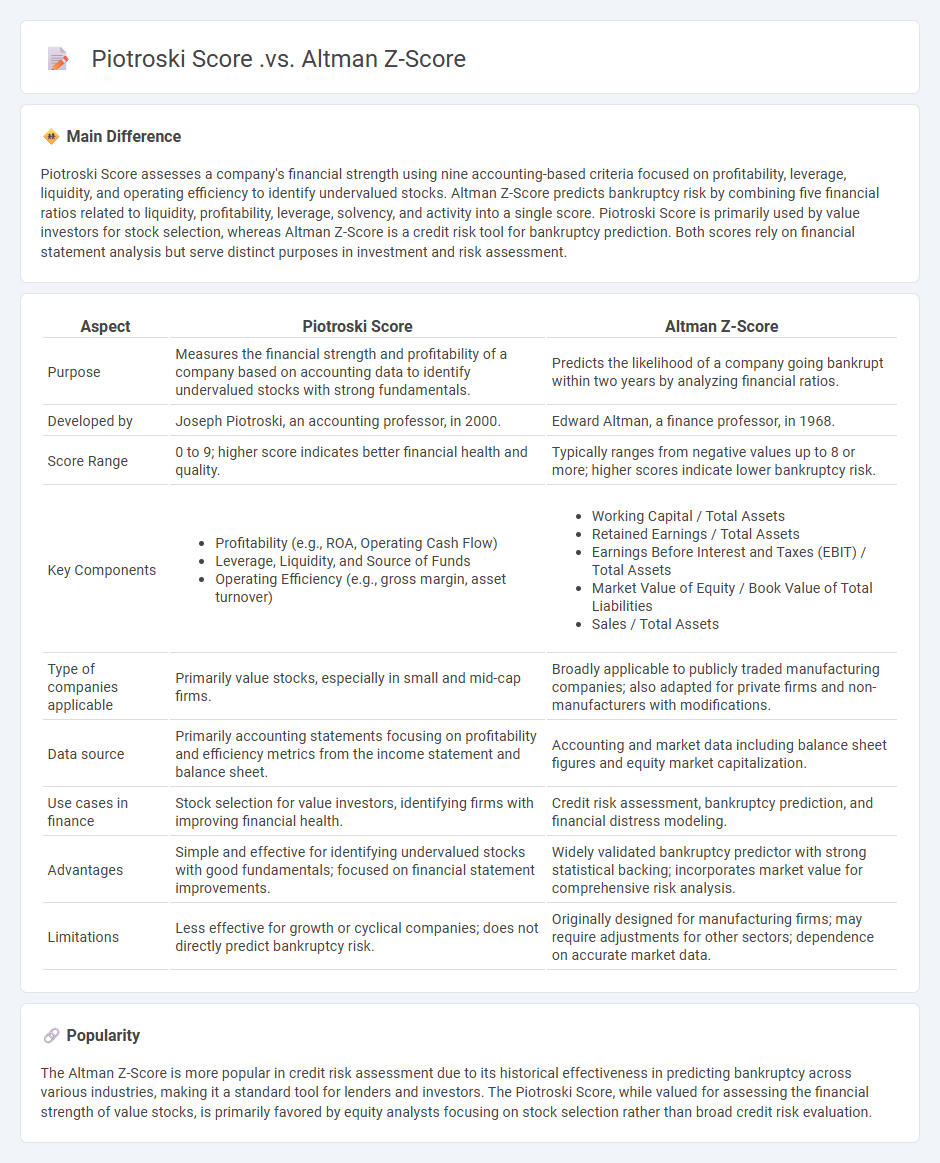
Piotroski Score assesses a company's financial strength using nine accounting-based criteria focused on profitability, leverage, liquidity, and operating efficiency to identify undervalued stocks. Altman Z-Score predicts bankruptcy risk by combining five financial ratios related to liquidity, profitability, leverage, solvency, and activity into a single score. Piotroski Score is primarily used by value investors for stock selection, whereas Altman Z-Score is a credit risk tool for bankruptcy prediction. Both scores rely on financial statement analysis but serve distinct purposes in investment and risk assessment.
Connection
The Piotroski Score and Altman Z-Score are both financial models used to assess a company's financial health, with the Piotroski Score focusing on profitability, leverage, and operational efficiency, while the Altman Z-Score predicts bankruptcy risk using liquidity, profitability, leverage, solvency, and activity ratios. A high Piotroski Score often indicates strong financial performance, which correlates with a higher Altman Z-Score, suggesting lower bankruptcy risk. Investors use both scores together to gain a comprehensive view of a company's financial stability and potential investment risk.
Comparison Table
| Aspect | Piotroski Score | Altman Z-Score |
|---|---|---|
| Purpose | Measures the financial strength and profitability of a company based on accounting data to identify undervalued stocks with strong fundamentals. | Predicts the likelihood of a company going bankrupt within two years by analyzing financial ratios. |
| Developed by | Joseph Piotroski, an accounting professor, in 2000. | Edward Altman, a finance professor, in 1968. |
| Score Range | 0 to 9; higher score indicates better financial health and quality. | Typically ranges from negative values up to 8 or more; higher scores indicate lower bankruptcy risk. |
| Key Components |
|
|
| Type of companies applicable | Primarily value stocks, especially in small and mid-cap firms. | Broadly applicable to publicly traded manufacturing companies; also adapted for private firms and non-manufacturers with modifications. |
| Data source | Primarily accounting statements focusing on profitability and efficiency metrics from the income statement and balance sheet. | Accounting and market data including balance sheet figures and equity market capitalization. |
| Use cases in finance | Stock selection for value investors, identifying firms with improving financial health. | Credit risk assessment, bankruptcy prediction, and financial distress modeling. |
| Advantages | Simple and effective for identifying undervalued stocks with good fundamentals; focused on financial statement improvements. | Widely validated bankruptcy predictor with strong statistical backing; incorporates market value for comprehensive risk analysis. |
| Limitations | Less effective for growth or cyclical companies; does not directly predict bankruptcy risk. | Originally designed for manufacturing firms; may require adjustments for other sectors; dependence on accurate market data. |
Financial Health Assessment
Financial health assessment evaluates a company's ability to meet its long-term obligations, operate efficiently, and generate sustainable profit. Key metrics include liquidity ratios like the current ratio, solvency ratios such as debt to equity, and profitability indicators like net profit margin. Analysts often use balance sheets, income statements, and cash flow statements from sources like SEC filings to perform comprehensive evaluations. Accurate financial health assessments guide investment decisions and strategic planning for businesses and stakeholders.
Profitability Indicators
Profitability indicators measure a company's ability to generate earnings relative to its revenue, assets, or equity. Key metrics include Return on Assets (ROA), Return on Equity (ROE), and Net Profit Margin, which provide insights into operational efficiency and financial health. Analysts use these ratios to compare business performance across industries and assess management effectiveness in maximizing shareholder value. Regular evaluation of profitability indicators supports informed investment decisions and strategic planning.
Bankruptcy Prediction
Bankruptcy prediction in finance involves using quantitative models and machine learning algorithms to assess the likelihood of a firm's financial distress or insolvency. Key financial ratios such as debt-to-equity, current ratio, and return on assets serve as critical predictors in statistical models like Altman's Z-score and logistic regression. Recent advancements incorporate artificial intelligence techniques, including neural networks and support vector machines, to improve prediction accuracy based on historical financial statements. Accurate bankruptcy prediction aids investors, creditors, and regulators in mitigating risks and enhancing decision-making processes.
Scoring Methodology
Scoring methodology in finance refers to quantitative models used to evaluate creditworthiness, investment risks, or financial performance based on historical data and statistical techniques. Credit scoring systems, such as FICO scores, analyze factors like payment history, credit utilization, and length of credit to predict default probabilities. Investment scoring models assess asset risk by incorporating indicators like volatility, return rates, and macroeconomic variables. Financial institutions rely on these methodologies to improve decision-making accuracy and regulatory compliance.
Risk Evaluation
Risk evaluation in finance involves assessing the probability and impact of potential losses on investments or projects. It quantifies financial risks through metrics like Value at Risk (VaR), beta coefficients, and credit ratings. Financial institutions use risk evaluation to determine capital reserves required under regulatory frameworks such as Basel III. Effective risk evaluation supports portfolio diversification and strategic decision-making to maximize returns while minimizing exposure to adverse market fluctuations.
Source and External Links
Essential Checks: Safeguarding Your Investments - The Piotroski Score evaluates financial strength using profitability, solvency, and efficiency criteria, whereas the Altman Z-Score predicts bankruptcy risk by analyzing liquidity, profitability, leverage, market value, and activity ratios, with thresholds indicating safe, grey, or distress zones.
Piotroski Score - Financial Modeling Prep API | FMP - The Piotroski Score ranges from 0 to 9 based on nine criteria assessing profitability, leverage, and liquidity, while Altman Z-Score uses weighted financial ratios to identify financial distress risk.
Should You Invest Using Scoring Systems? - The Piotroski F-Score, developed from US data, helps eliminate firms with poor prospects focusing on small to medium firms, whereas the Altman Z-score is widely used to assess bankruptcy likelihood, but both require careful application depending on market context.
FAQs
What is the Piotroski Score?
The Piotroski Score is a financial metric ranging from 0 to 9 that evaluates a company's financial strength based on nine criteria in profitability, leverage, liquidity, and operating efficiency.
What is the Altman Z-Score?
The Altman Z-Score is a financial metric used to predict a company's likelihood of bankruptcy by combining five key financial ratios into a single score.
How does the Piotroski Score differ from the Altman Z-Score?
The Piotroski Score evaluates a firm's financial strength using nine accounting-based criteria focused on profitability, leverage, liquidity, and operating efficiency, while the Altman Z-Score predicts bankruptcy risk by combining five weighted financial ratios related to liquidity, profitability, leverage, solvency, and activity.
What factors are included in the Piotroski Score?
The Piotroski Score includes nine factors: profitability (positive net income, positive operating cash flow, higher return on assets, quality of earnings), leverage/liquidity (lower long-term debt to assets, higher current ratio), and operating efficiency (higher gross margin, higher asset turnover, and no issuance of new shares).
What are the components of the Altman Z-Score?
The Altman Z-Score components are Working Capital/Total Assets, Retained Earnings/Total Assets, Earnings Before Interest and Taxes (EBIT)/Total Assets, Market Value of Equity/Total Liabilities, and Sales/Total Assets.
How are these scores used in financial analysis?
Credit scores assess borrower risk, impacting loan approvals, interest rates, and credit limits in financial analysis.
Which score is more effective at predicting bankruptcy?
The Altman Z-Score is more effective at predicting bankruptcy compared to other financial distress models.