Sharpe Ratio measures the risk-adjusted return by comparing portfolio returns to total volatility, emphasizing overall risk. Treynor Ratio evaluates returns relative to systematic risk, focusing on market-related volatility through beta. Explore how these metrics differ to optimize investment decisions effectively.
Main Difference
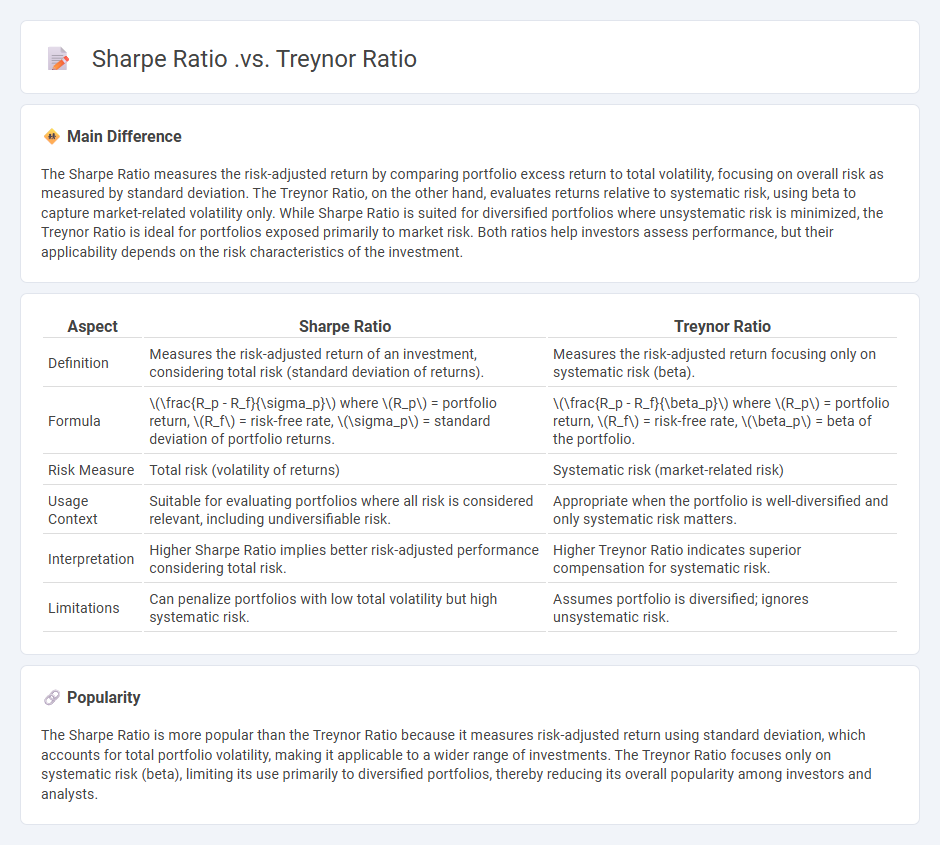
The Sharpe Ratio measures the risk-adjusted return by comparing portfolio excess return to total volatility, focusing on overall risk as measured by standard deviation. The Treynor Ratio, on the other hand, evaluates returns relative to systematic risk, using beta to capture market-related volatility only. While Sharpe Ratio is suited for diversified portfolios where unsystematic risk is minimized, the Treynor Ratio is ideal for portfolios exposed primarily to market risk. Both ratios help investors assess performance, but their applicability depends on the risk characteristics of the investment.
Connection
Sharpe Ratio and Treynor Ratio both measure risk-adjusted returns but differ by the type of risk they consider; Sharpe Ratio uses total portfolio risk (standard deviation), while Treynor Ratio focuses solely on systematic risk (beta). Both ratios help investors evaluate portfolio performance relative to risk, with higher values indicating better risk compensation. These metrics are crucial for portfolio optimization and strategic asset allocation in investment management.
Comparison Table
| Aspect | Sharpe Ratio | Treynor Ratio |
|---|---|---|
| Definition | Measures the risk-adjusted return of an investment, considering total risk (standard deviation of returns). | Measures the risk-adjusted return focusing only on systematic risk (beta). |
| Formula | \(\frac{R_p - R_f}{\sigma_p}\) where \(R_p\) = portfolio return, \(R_f\) = risk-free rate, \(\sigma_p\) = standard deviation of portfolio returns. | \(\frac{R_p - R_f}{\beta_p}\) where \(R_p\) = portfolio return, \(R_f\) = risk-free rate, \(\beta_p\) = beta of the portfolio. |
| Risk Measure | Total risk (volatility of returns) | Systematic risk (market-related risk) |
| Usage Context | Suitable for evaluating portfolios where all risk is considered relevant, including undiversifiable risk. | Appropriate when the portfolio is well-diversified and only systematic risk matters. |
| Interpretation | Higher Sharpe Ratio implies better risk-adjusted performance considering total risk. | Higher Treynor Ratio indicates superior compensation for systematic risk. |
| Limitations | Can penalize portfolios with low total volatility but high systematic risk. | Assumes portfolio is diversified; ignores unsystematic risk. |
Risk-Adjusted Return
Risk-adjusted return measures the profitability of an investment by accounting for the amount of risk involved, enabling investors to compare the performance of diverse assets. Common metrics include the Sharpe Ratio, which evaluates excess return per unit of volatility using historical data, and the Treynor Ratio, which considers systematic risk based on beta coefficients relative to the market. The Sortino Ratio focuses on downside deviation, isolating harmful volatility rather than total volatility in assessing returns. These measures aid portfolio managers and analysts in optimizing asset allocation and benchmarking fund performance against risk levels.
Total Risk (Standard Deviation)
Total Risk, measured by standard deviation, quantifies the overall volatility of an investment's returns, encompassing both systematic and unsystematic risks. It reflects the dispersion of returns around the mean, indicating the degree of uncertainty an investor faces. In financial markets, assets with higher standard deviations typically exhibit greater price fluctuations and potential for both gains and losses. Understanding total risk helps investors assess the variability of returns and make informed decisions based on their risk tolerance.
Systematic Risk (Beta)
Systematic risk, measured by beta, quantifies an asset's sensitivity to overall market movements, with a beta of 1 indicating perfect correlation to market returns. A beta greater than 1 signifies higher volatility than the market, implying greater exposure to macroeconomic factors such as interest rate changes and geopolitical events. Portfolio managers use beta to optimize asset allocation, balancing expected return against market risk. This metric is central in the Capital Asset Pricing Model (CAPM), which calculates expected returns based on risk-free rates plus beta-adjusted market risk premium.
Portfolio Performance Measurement
Portfolio performance measurement evaluates investment returns by comparing realized gains to benchmark indices like the S&P 500 or MSCI World Index. Key metrics include the Sharpe Ratio, which assesses risk-adjusted returns, and the Jensen's Alpha, measuring excess returns above expected market performance. This analysis enables investors to identify skillful fund managers, optimize asset allocation, and enhance portfolio efficiency. Real-time performance tracking incorporates factors such as volatility, drawdowns, and benchmark variance to provide comprehensive insights.
Diversification
Diversification in finance involves spreading investments across various asset classes, industries, and geographic regions to reduce risk. By combining assets with low or negative correlations, investors can minimize portfolio volatility and improve risk-adjusted returns. According to Modern Portfolio Theory developed by Harry Markowitz, diversification helps in achieving an efficient frontier of optimal portfolios. Empirical studies show diversified portfolios historically outperform non-diversified ones under varying market conditions.
Source and External Links
Treynor Ratio vs. Sharpe Ratio: A Complete Guide - SmartAsset - The Sharpe ratio measures total risk using standard deviation, suitable for less diversified portfolios, while the Treynor ratio measures only systematic risk via beta, ideal for well-diversified portfolios.
Treynor Ratio vs. Sharpe Ratio: A Complete Guide - Nasdaq - Sharpe ratio accounts for total volatility; Treynor ratio focuses on market-related risk, making them appropriate for different portfolio diversification levels.
Treynor Ratio - Explained, Formula, Example - Treynor ratio evaluates returns relative to systematic risk (beta) and suits diversified portfolios, while Sharpe ratio evaluates returns against total risk, suitable for less diversified portfolios.
FAQs
What is the Sharpe Ratio?
The Sharpe Ratio measures the risk-adjusted return of an investment by calculating the average return earned in excess of the risk-free rate per unit of volatility or total risk.
What is the Treynor Ratio?
The Treynor Ratio measures a portfolio's excess return per unit of systematic risk, calculated as (Portfolio Return - Risk-Free Rate) divided by Beta.
What is the difference between Sharpe and Treynor Ratios?
The Sharpe Ratio measures risk-adjusted return using total portfolio risk (standard deviation), while the Treynor Ratio evaluates risk-adjusted return based on systematic risk (beta).
How is the Sharpe Ratio calculated?
The Sharpe Ratio is calculated by subtracting the risk-free rate from the portfolio's return, then dividing the result by the portfolio's standard deviation of returns.
How is the Treynor Ratio calculated?
The Treynor Ratio is calculated by subtracting the risk-free rate from the portfolio's return and then dividing the result by the portfolio's beta: Treynor Ratio = (Portfolio Return - Risk-Free Rate) / Beta.
When should you use Sharpe Ratio instead of Treynor Ratio?
Use the Sharpe Ratio instead of the Treynor Ratio when assessing the overall risk-adjusted performance of a portfolio considering total volatility (standard deviation) rather than just systematic risk (beta).
Why are Sharpe and Treynor Ratios important for investors?
Sharpe and Treynor Ratios are important for investors because they measure risk-adjusted performance, with Sharpe Ratio evaluating returns relative to total portfolio volatility and Treynor Ratio assessing returns against systematic risk using beta, enabling better comparison and optimization of investment strategies.