Gaussian Copula captures linear dependence by modeling joint distributions with Gaussian marginals, making it suitable for scenarios with symmetric tail behavior. t-Copula extends this by incorporating heavier tails through Student's t-distributions, better representing extreme co-movements and tail dependencies in financial risk modeling. Discover the differences in tail dependence and risk assessment between Gaussian and t-Copulas to select the optimal approach for your data analysis.
Main Difference
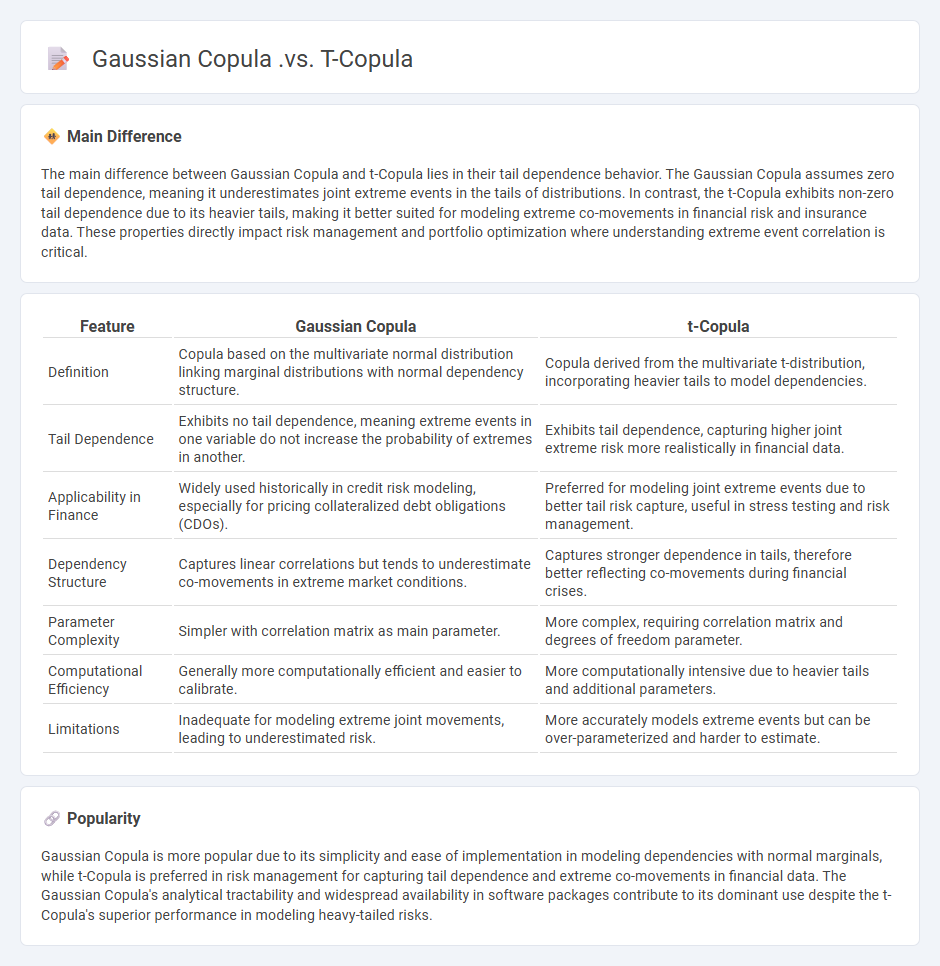
The main difference between Gaussian Copula and t-Copula lies in their tail dependence behavior. The Gaussian Copula assumes zero tail dependence, meaning it underestimates joint extreme events in the tails of distributions. In contrast, the t-Copula exhibits non-zero tail dependence due to its heavier tails, making it better suited for modeling extreme co-movements in financial risk and insurance data. These properties directly impact risk management and portfolio optimization where understanding extreme event correlation is critical.
Connection
Gaussian copula and t-copula are both types of copula functions used to model dependence structures between random variables, particularly in multivariate distributions. The Gaussian copula is derived from the multivariate normal distribution and captures linear correlation but lacks tail dependence, while the t-copula stems from the multivariate Student's t-distribution and accounts for tail dependence, making it more suitable for modeling extreme co-movements. Both copulas share a similar mathematical framework but differ in their ability to represent tail risk and dependence strength in the tails of the distribution.
Comparison Table
| Feature | Gaussian Copula | t-Copula |
|---|---|---|
| Definition | Copula based on the multivariate normal distribution linking marginal distributions with normal dependency structure. | Copula derived from the multivariate t-distribution, incorporating heavier tails to model dependencies. |
| Tail Dependence | Exhibits no tail dependence, meaning extreme events in one variable do not increase the probability of extremes in another. | Exhibits tail dependence, capturing higher joint extreme risk more realistically in financial data. |
| Applicability in Finance | Widely used historically in credit risk modeling, especially for pricing collateralized debt obligations (CDOs). | Preferred for modeling joint extreme events due to better tail risk capture, useful in stress testing and risk management. |
| Dependency Structure | Captures linear correlations but tends to underestimate co-movements in extreme market conditions. | Captures stronger dependence in tails, therefore better reflecting co-movements during financial crises. |
| Parameter Complexity | Simpler with correlation matrix as main parameter. | More complex, requiring correlation matrix and degrees of freedom parameter. |
| Computational Efficiency | Generally more computationally efficient and easier to calibrate. | More computationally intensive due to heavier tails and additional parameters. |
| Limitations | Inadequate for modeling extreme joint movements, leading to underestimated risk. | More accurately models extreme events but can be over-parameterized and harder to estimate. |
Dependency Structure
In finance, dependency structure refers to the relationship and interconnection between different financial assets or variables, influencing their joint behavior and risk profile. Such structures are crucial for portfolio optimization, managing systemic risk, and pricing multi-asset derivatives by capturing correlations and co-movements. Techniques like copulas and variance-covariance matrices are commonly employed to model dependency structures accurately. Understanding these dependencies aids in diversification and enhances the robustness of financial risk management strategies.
Tail Dependence
Tail dependence in finance measures the probability that extreme losses or gains occur simultaneously across multiple assets or portfolios during market stress. It quantifies the co-movement of asset returns in the tails of their distributions, often modeled using copulas like the Clayton or Gumbel copula. High tail dependence indicates systemic risk, where diversification benefits diminish in crises, impacting risk management and portfolio optimization. Financial institutions leverage tail dependence metrics to better assess joint extreme events and enhance stress-testing frameworks.
Correlation Matrix
A correlation matrix in finance quantifies the degree of linear relationship between multiple asset returns, aiding in portfolio diversification and risk management. Each cell in the matrix displays the correlation coefficient, ranging from -1 to 1, indicating perfect negative to perfect positive correlation respectively. Investors use correlation matrices to identify pairs or groups of assets that move independently or oppositely, enhancing strategies to minimize portfolio volatility. Prominent financial tools like Python's pandas and Excel's Data Analysis Toolpak facilitate the calculation and visualization of correlation matrices for equity, bond, and commodity returns.
Marginal Distributions
Marginal distributions in finance analyze the probability distribution of individual financial variables, such as asset returns or interest rates, while disregarding the influence of other variables. They are critical for risk assessment, portfolio optimization, and derivative pricing by providing insights into the behavior of single assets. For example, understanding the marginal distribution of stock returns helps quantify the likelihood of extreme losses, aiding in Value at Risk (VaR) calculations. Common models include normal, log-normal, and heavy-tailed distributions, reflecting empirical asset return characteristics.
Extreme Event Modeling
Extreme event modeling in finance focuses on assessing the probability and impact of rare but severe market movements, such as financial crashes and systemic risks. Techniques like Extreme Value Theory (EVT) and Generalized Pareto Distribution (GPD) are widely used to estimate tail risk and Value at Risk (VaR) under extreme market conditions. Financial institutions employ stress testing and scenario analysis to prepare for low-probability, high-impact events that standard models may underestimate. Accurate extreme event modeling enhances risk management frameworks and regulatory compliance, crucial during market turbulence.
Source and External Links
The t Copula and Related Copulas - The Gaussian copula has zero tail dependence, while the t-copula exhibits positive tail dependence, capturing joint extreme events better.
It was the best of tails, it was the worst of tails: The T-Copula - The t-copula, derived from the multivariate t-distribution, has a degrees of freedom parameter that controls tail heaviness, unlike the Gaussian copula which has no tail dependence.
Different Correlation Structures in Copulas - As the degrees of freedom increase, the t-copula converges to the Gaussian copula, but for finite degrees of freedom, the t-copula shows stronger dependence in both tails compared to the Gaussian copula.
FAQs
What is a copula in statistics?
A copula in statistics is a function that links univariate marginal distribution functions to form a multivariate distribution, capturing the dependence structure between random variables.
What is the Gaussian copula?
The Gaussian copula is a mathematical function used to model and analyze the dependence structure between multiple random variables by linking their marginal distributions to form a joint multivariate normal distribution.
What is the t-copula?
The t-copula is a multivariate copula derived from the Student's t-distribution that models dependencies with heavier tails, capturing tail dependence between variables more effectively than the Gaussian copula.
How do Gaussian and t-copulas differ in modeling dependence?
Gaussian copulas model dependence using linear correlation and symmetric tail dependence, while t-copulas capture both linear correlation and stronger symmetric tail dependence, making them better suited for modeling extreme co-movements.
Why choose a t-copula over a Gaussian copula?
Choose a t-copula over a Gaussian copula for better modeling of tail dependence and extreme co-movements in multivariate data, especially in financial risk management.
What are the limitations of Gaussian copulas?
Gaussian copulas are limited by their inability to capture tail dependence, assume symmetric dependencies, struggle with modeling extreme events, and often underestimate joint default risks in financial applications.
How are copulas used in financial risk management?
Copulas model and analyze the dependence structure between multiple financial risk factors, allowing accurate joint distribution estimation and improved portfolio risk assessment.